. 2011 Dec 16:11:124.
doi: 10.1186/1472-6750-11-124.

Real-time PCR-based assay to quantify the relative amount of human and mouse tissue present in tumor xenografts

Affiliations

Real-time PCR-based assay to quantify the relative amount of human and mouse tissue present in tumor xenografts

Sergio Y Alcoser et al. BMC Biotechnol. .

Abstract

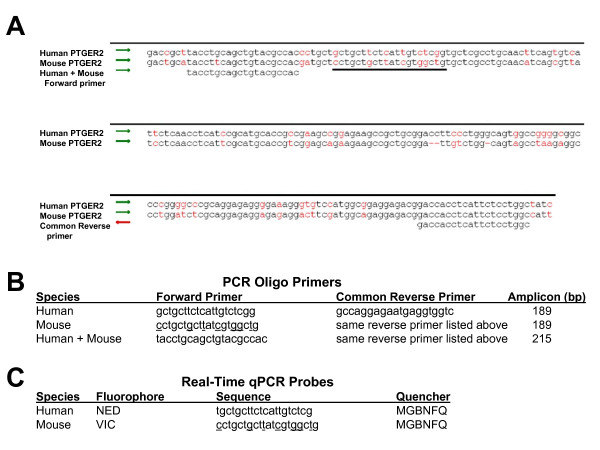
Background: Xenograft samples used to test anti-cancer drug efficacies and toxicities in vivo contain an unknown mix of mouse and human cells. Evaluation of drug activity can be confounded by samples containing large amounts of contaminating mouse tissue. We have developed a real-time quantitative polymerase chain reaction (qPCR) assay using TaqMan technology to quantify the amount of mouse tissue that is incorporated into human xenograft samples.

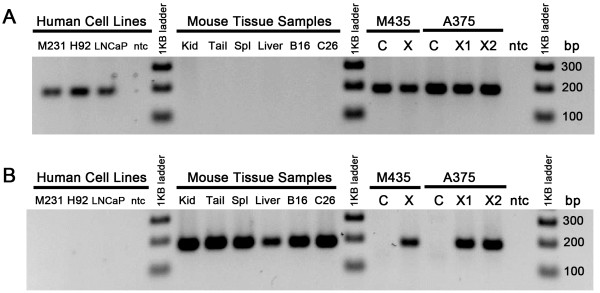
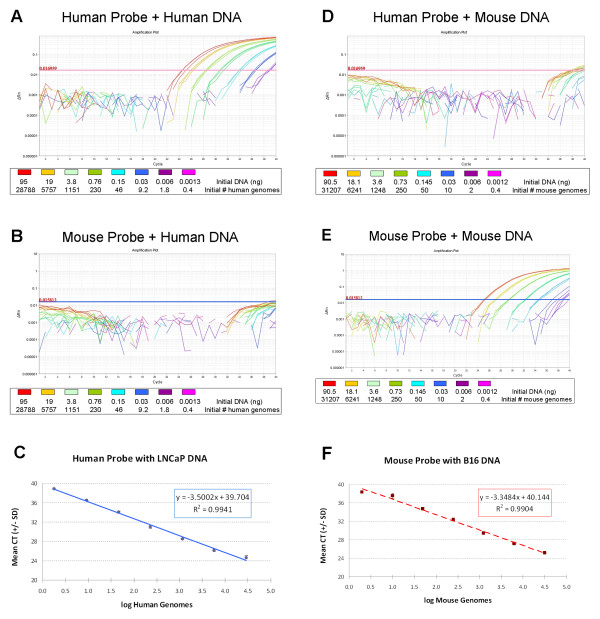
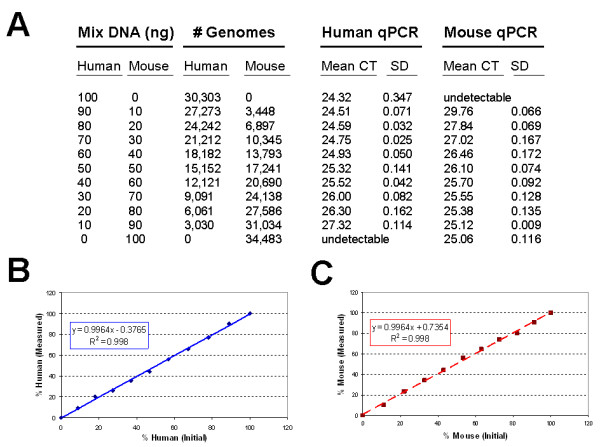
Results: The forward and reverse primers bind to the same DNA sequence in the human and the mouse genome. Using a set of specially designed fluorescent probes provides species specificity. The linearity and sensitivity of the assay is evaluated using serial dilutions of single species and heterogeneous DNA mixtures. We examined many xenograft samples at various in vivo passages, finding a wide variety of human:mouse DNA ratios. This variation may be influenced by tumor type, number of serial passages in vivo, and even which part of the tumor was collected and used in the assay.

Conclusions: This novel assay provides an accurate quantitative assessment of human and mouse content in xenograft tumors. This assay can be performed on aberrantly behaving human xenografts, samples used in bioinformatics studies, and periodically for tumor tissue frequently grown by serial passage in vivo.


Figures

Figure 1
Figure 1
Relevant species alignment using the PTGER2 gene and the PCR primers and real-time qPCR probe sequences derived from the alignment. A) The human and mouse PTGER2 DNA sequences are aligned, with red letters signifying non-conserved basepairs. Human+Mouse PCR primers are listed underneath, and a black bar is below the qPCR probe sequence. The reverse-compliment Common Reverse primer sequence is shown to illustrate alignment on the DNA strand shown. B) Qualitative PCR primers are listed, as well as the expected size of the amplified sequence. All sequences listed 5' to 3'. Mouse genome specific base pairs are underlined in the mouse forward primer and mouse probe sequences. C) Real-time qPCR probe sequences are listed next to their fluorophore and quencher.
Figure 2
Figure 2
Species specificity of the qualitative PCR primers. Panel A was generated using the human-forward and common reverse primers listed in Figure 1B. Only samples containing human cells show the human 189 bp band. Panel B uses the mouse-forward and common reverse primers listed in Figure 1B. Only samples containing genomic mouse DNA show the expected mouse amplicon. As expected, the serially passaged xenograft samples show the presence of both human and mouse DNA, as early as the first in vivo passage (X) and even after ten in vivo serial passages (lanes X1 and X2). Acronyms: M231 (MDA-MB-231 human breast cancer cells), H92 (HOP-92 human lung cancer cells), LNCaP (LNCaP human prostate cancer cells), ntc (no template control), Kid (kidney), Spl (spleen), B16 (B16F10 mouse melanoma tumor), C26 (Colon-26 mouse colon tumor), M435 (MDA-MB-435 human melanoma), A375 (human malignant melanoma), C (cultured cell line), X (xenograft, harvested after one passage in vivo), X1 and X2 (xenograft, harvested after ten serial passages in vivo), bp (base pairs).
Figure 3
Figure 3
Representative example of real-time qPCR fluorescent signal traces (ΔRn vs cycles) showing species specificity of the qPCR probes and a species-specific standard curve derived from each data set. A) The human probe shows robust DNA amplification signals in samples consisting of only LNCaP human prostate carcinoma cell line template DNA. B) In the same LNCaP samples, the mouse probe shows no binding or product amplification. C) Plotting mean CT (+/- SD) vs log human genomes initially present in the qPCR reaction tube, the serial dilution from (A) is linear down to 1.8 human haploid genomes. D) The human-specific probe does not bind to B16F10 mouse melanoma tumor template DNA. E) The mouse-specific probe does show amplification when using B16F10 mouse tumor DNA as a template. F) A standard curve derived from the mean mouse probe CT signal plotted against log mouse genomes present in (E) shows a linear correlation down to 2 initial genomes.
Figure 4
Figure 4
Example of a serial dilution study to verify linearity in mixed DNA samples. A) Each sample contains 100 ng total DNA, composed of various ratios of mouse kidney and human MDA-MB-435 melanoma cell line DNA in regular 10 ng increments. The corresponding numbers of initial haploid genomes are calculated, and the mean CT and SD from the qPCR results for reach probe are listed. B) Plotting the measured number of human genomes (y-axis) versus the known number of initial human genomes present in each sample (x-axis) yields a linear curve (blue line) with R2 = 0.998. C) Similarly, plotting the measured number of mouse genomes versus the initial number of mouse genomes yields a linear curve with R2 = 0.998.

References

    1. Clevers H. The cancer stem cell: premises, promises and challenges. Nat Med. 2011;17(3):313–9. - PubMed
    1. Plowman J, Dykes DJ, Hollingshead M, Simpson-Herren L, Alley MC. In: Anticancer drug development guide: preclinical screening, clinical trials and approval. 1. Teicher B, editor. Totowa (NJ): Humana Press, Inc; 1997. Human tumor xenograft models in NCI drug development; pp. 101–25.
    1. Beattie GM, Knowles AF, Jensen FC, Baird SM, Kaplan NO. Induction of sarcomas in athymic mice. Proc Natl Acad Sci USA. 1982;79(9):3033–6. doi: 10.1073/pnas.79.9.3033. - DOI - PMC - PubMed
    1. Staab HJ, Heilbronner H, Schrader M, Anderer FA. In vivo induction of neoplastic growth in nude mouse connective tissue adjacent to xenografted human tumors. J Cancer Res Clin Oncol. 1983;106(1):27–35. doi: 10.1007/BF00399894. - DOI - PubMed
    1. Sparrow S, Jones M, Billington S, Stace B. The in vivo malignant transformation of mouse fibroblasts in the presence of human tumour xenografts. Br J Cancer. 1986;53(6):793–7. doi: 10.1038/bjc.1986.134. - DOI - PMC - PubMed

Publication types

LinkOut - more resources