. 2011 Dec 17:12:480.
doi: 10.1186/1471-2105-12-480.

GC-content normalization for RNA-Seq data

Affiliations

GC-content normalization for RNA-Seq data

Davide Risso et al. BMC Bioinformatics. .

Abstract

Background: Transcriptome sequencing (RNA-Seq) has become the assay of choice for high-throughput studies of gene expression. However, as is the case with microarrays, major technology-related artifacts and biases affect the resulting expression measures. Normalization is therefore essential to ensure accurate inference of expression levels and subsequent analyses thereof.

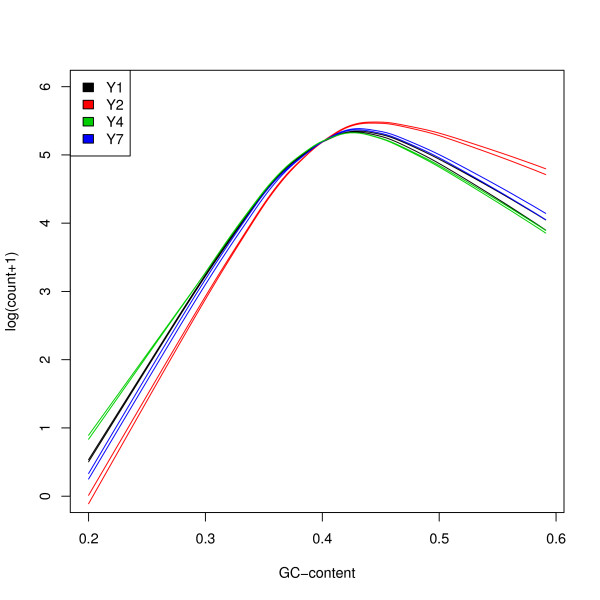
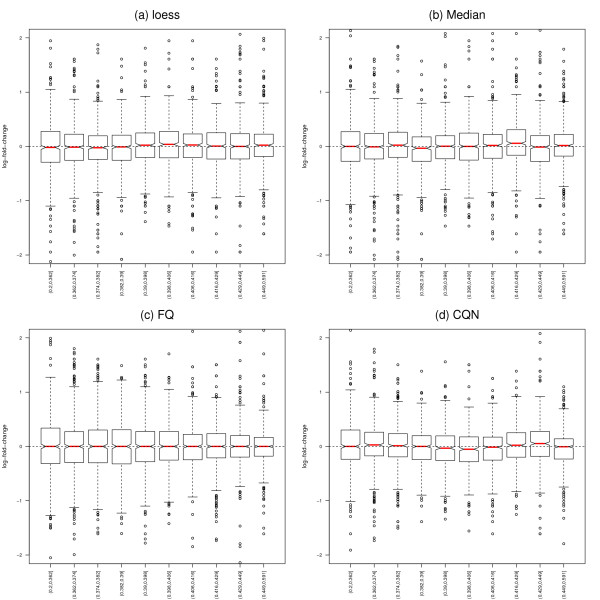
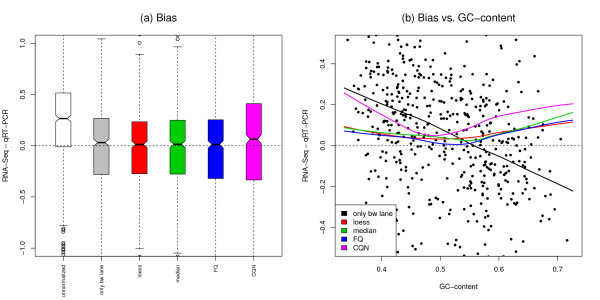
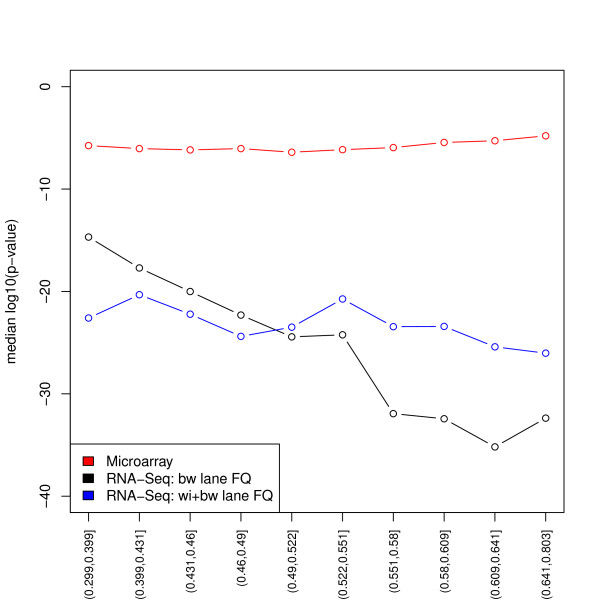
Results: We focus on biases related to GC-content and demonstrate the existence of strong sample-specific GC-content effects on RNA-Seq read counts, which can substantially bias differential expression analysis. We propose three simple within-lane gene-level GC-content normalization approaches and assess their performance on two different RNA-Seq datasets, involving different species and experimental designs. Our methods are compared to state-of-the-art normalization procedures in terms of bias and mean squared error for expression fold-change estimation and in terms of Type I error and p-value distributions for tests of differential expression. The exploratory data analysis and normalization methods proposed in this article are implemented in the open-source Bioconductor R package EDASeq.

Conclusions: Our within-lane normalization procedures, followed by between-lane normalization, reduce GC-content bias and lead to more accurate estimates of expression fold-changes and tests of differential expression. Such results are crucial for the biological interpretation of RNA-Seq experiments, where downstream analyses can be sensitive to the supplied lists of genes.


Figures

Figure 1
Figure 1
Yeast dataset: Read count vs. GC-content. Lowess fits of gene-level log(count + 1) vs. GC-content for the eight YPD lanes from the Yeast dataset, after FQ between-lane normalization. Curves are colored according to culture/library preparation. The GC-content effect is the same for lanes assaying the same culture/library preparation, but can be different for lanes assaying different cultures/library preparations. Figure S4 displays the scatterplot and lowess fit for the first YPD lane (culture/library preparation Y1, flow-cell 428R1).
Figure 2
Figure 2
Yeast dataset: Log-fold-change vs. GC-content. Stratified boxplots of count log-ratio vs. GC-content, after FQ between-lane normalization. Panel (a): Same culture/library preparation, YPD Y1 lanes from flow-cells 428R1 vs. 4328B. Panel (b): Different cultures/library preparations, YPD Y1 lane vs. Y2 lane from flow-cell 428R1. The GC-content effect is the same for the two lanes assaying the same culture/library preparation, so that fold-change estimates do not vary with GC-content. By contrast, the GC-content effect differs between cultures/library preparations and confounds fold-change estimation.
Figure 3
Figure 3
Yeast dataset: GC-normalized log-fold-change vs. GC-content. Stratified boxplots of count log-ratio vs. GC-content, for the two YPD cultures/library preparations of Figure 2, Panel (b), for four within-lane GC-content normalization procedures. Panel (a): Regression normalization using loess. Panel (b): Global-scaling normalization using the median. Panel (c): Full-quantile (FQ) normalization. Panel (d): Conditional quantile normalization (CQN). The first three within-lane procedures were followed by FQ between-lane normalization; CQN includes its own between-lane normalization. All methods seem to effectively reduce the dependence of fold-change on GC-content (compared to Figure 2, Panel (b)).
Figure 4
Figure 4
MAQC-2 dataset: Bias in fold-change estimation. Bias in UHR/Brain expression log-fold-change estimation for different RNA-Seq normalization procedures, where bias is defined as the difference between the estimates from RNA-Seq and qRT-PCR for 638 genes assayed by both technologies. Panel (a): Boxplots of bias in log-fold-change estimates. Our three proposed normalization procedures reduce bias, while CQN tends to overestimate the UHR/Brain fold-change. Panel (b): Dependence of bias on GC-content. The points correspond to bias after only FQ between-lane normalization, the curves are lowess fits of bias vs. GC-content for different normalization procedures. There is still substantial dependence of bias on GC-content after CQN.
Figure 5
Figure 5
Yeast YPD pseudo-datasets: Type I error. Difference between actual and nominal Type I error rates vs. nominal Type I error rate, for different normalization procedures. The colored areas correspond to the most conservative and most anti-conservative curves obtained from the 35 YPD pseudo-datasets. The dashed line corresponds to a nominal unadjusted p-value of 0.05. The full-quantile GC-content normalization procedure yields the smallest area, meaning that the actual Type I error rate is closer to the nominal Type I error rate than with the other two procedures.
Figure 6
Figure 6
Yeast dataset: Proportion of DE genes vs. GC-content. Here, a gene is declared DE between the three growth conditions if its nominal unadjusted p-value from the negative binomial LRT is below the threshold of 10-5 (corresponding to a nominal Bonferroni family wise error rate of 0.057 and Benjamini & Hochberg [37] false discovery rate of 4.22 × 10⁻⁵). There is a clear trend towards more detected differential expression at higher GC-content with all within-lane normalization procedures but the full-quantile.
Figure 7
Figure 7
MAQC-2 dataset: p-value vs. GC-content. Median unadjusted p-value (log10) for each GC-content stratum, for microarray and RNA-Seq UHR vs. Brain DE analysis (11,081 genes detected by RNA-Seq and present on the Affymetrix chip). The figure shows that the GC-content bias is technology-related and that full-quantile within-lane normalization reduces the dependence of RNA-Seq p-values on GC-content.

References

    1. Nagalakshmi U, Wang Z, Waern K, Shou C, Raha D, Gerstein M, Snyder M. The transcriptional landscape of the yeast genome defined by RNA sequencing. Science. 2008;320(5881):1344. doi: 10.1126/science.1158441. - DOI - PMC - PubMed
    1. Wang Z, Gerstein M, Snyder M. RNA-Seq: a revolutionary tool for transcriptomics. Nature Reviews Genetics. 2009;10:57–63. doi: 10.1038/nrg2484. - DOI - PMC - PubMed
    1. Bullard J, Purdom E, Hansen K, Dudoit S. Evaluation of statistical methods for normalization and differential expression in mRNA-Seq experiments. BMC Bioinformatics. 2010;11:94. doi: 10.1186/1471-2105-11-94. - DOI - PMC - PubMed
    1. Marioni J, Mason C, Mane S, Stephens M, Gilad Y. RNA-seq: an assessment of technical reproducibility and comparison with gene expression arrays. Genome Research. 2008;18(9):1509. doi: 10.1101/gr.079558.108. - DOI - PMC - PubMed
    1. Mortazavi A, Williams B, McCue K, Schaeffer L, Wold B. Mapping and quantifying mammalian transcriptomes by RNA-Seq. Nature Methods. 2008;5(7):621–628. doi: 10.1038/nmeth.1226. - DOI - PubMed

Publication types

MeSH terms