. 2012 Feb;177(2):202-11.
doi: 10.1016/j.jsb.2011.12.001. Epub 2011 Dec 8.

Cryo X-ray nano-tomography of vaccinia virus infected cells

Affiliations

Cryo X-ray nano-tomography of vaccinia virus infected cells

Francisco Javier Chichón et al. J Struct Biol. 2012 Feb.

Abstract

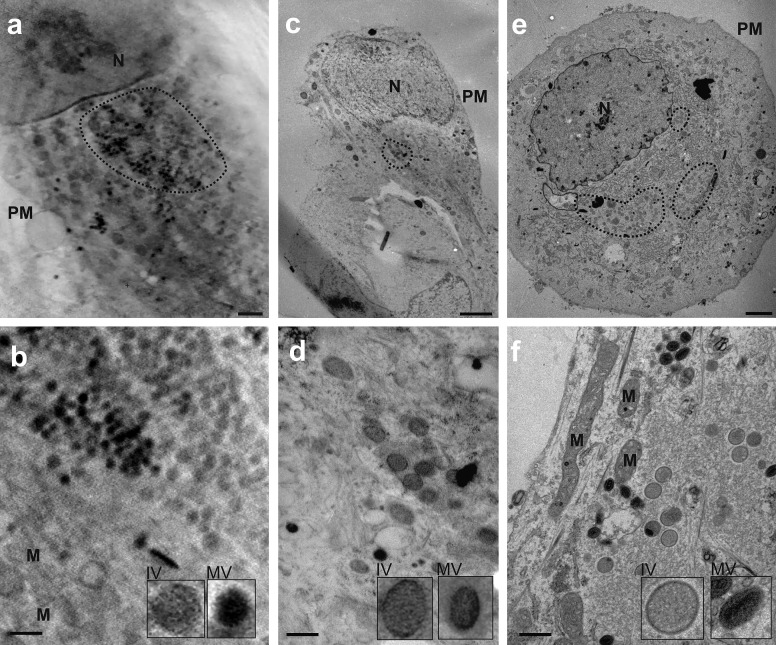
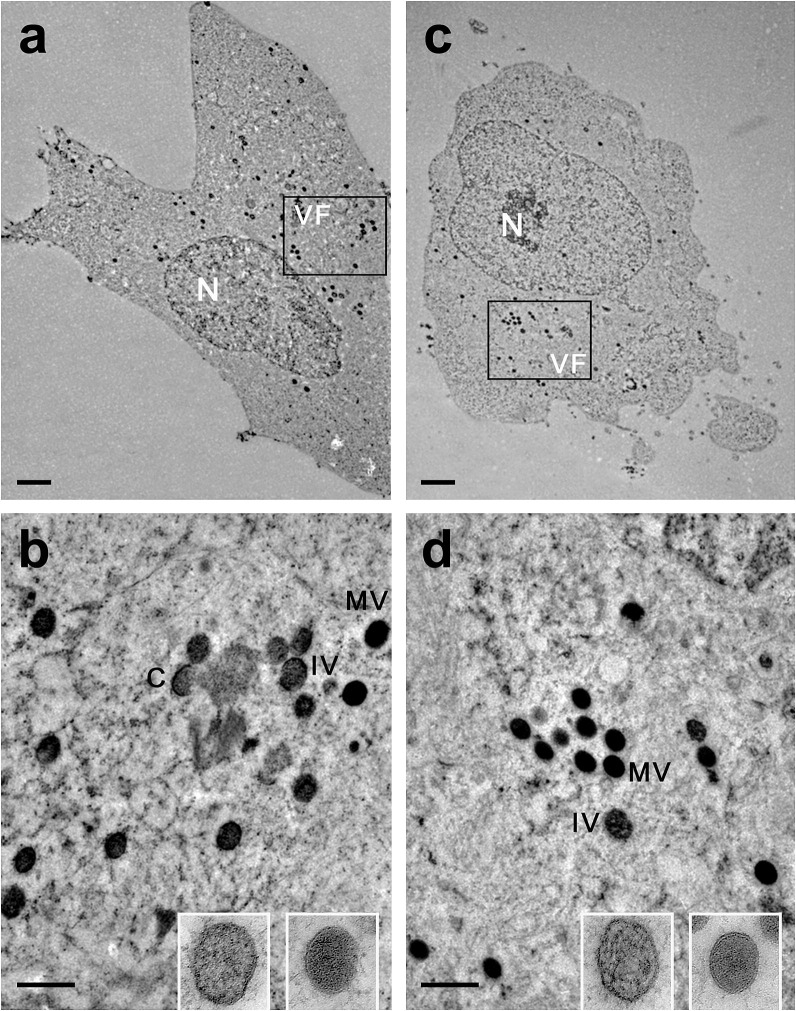
We have performed full-field cryo X-ray microscopy in the water window photon energy range on vaccinia virus (VACV) infected cells to produce tomographic reconstructions. PtK2 cells were infected with a GFP-expressing VACV strain and frozen by plunge fast freezing. The infected cells were selected by light fluorescence microscopy of the GFP marker and subsequently imaged in the X-ray microscope under cryogenic conditions. Tomographic tilt series of X-ray images were used to yield three-dimensional reconstructions showing different cell organelles (nuclei, mitochondria, filaments), together with other structures derived from the virus infection. Among them, it was possible to detect viral factories and two types of viral particles related to different maturation steps of VACV (immature and mature particles), which were compared to images obtained by standard electron microscopy of the same type of cells. In addition, the effect of radiation damage during X-ray tomographic acquisition was analyzed. Thin sections studied by electron microscopy revealed that the morphological features of the cells do not present noticeable changes after irradiation. Our findings show that cryo X-ray nano-tomography is a powerful tool for collecting three-dimensional structural information from frozen, unfixed, unstained whole cells with sufficient resolution to detect different virus particles exhibiting distinct maturation levels.


Figures

Fig.1
Fig.1
Analysis of virus growth of MVA-C-ΔF1L in PtK2 cells on grids. (a) PtK2 cells growing in normal conditions on coverslips visualized by optical phase contrast microscopy. The inset shows a higher magnification of the cells. (b) PtK2 cells growing under FCS deprivation on coverslips visualized by optical phase contrast microscopy. The inset shows a higher magnification of the cells were some vacuoles are visible. (c) Vaccinia virus infected PtK2 cells growing under FCS deprivation on IFR1 Au-grids with a formvar-carbon foil special for X-ray microscopy, visualized by optical phase contrast microscopy. The inset shows a higher magnification of the cells with a significant number of vacuoles in the cytoplasm. (a) and (c) share the same scale bar than (b). (d) TEM image from an epoxy-resin section of an infected cell under standard growth conditions. VA marks the position of some vacuoles. Scale bar represents 1 micron. (e) TEM image of epoxy-resin section of an infected cell under FCS deprivation. VA marks the position of vacuoles within the cytoplasm. Scale bar represents 1 micron. (f) Virus growth curve: Monolayers of PtK2 cells were infected with WR, MVA or MVA-C-ΔF1L at 0.01 PFU/cell. At different times post-infection (0, 24, 48 and 72 h), cells were harvested and virus titers in cell lysates were determined by plaque immunostaining assay in DF-1 cells using rabbit polyclonal antibody against vaccinia virus strain WR. (g) Stained foci in PtK2 cells infected with MVA or MVA-C-ΔF1L after immunostaining assay at 4 days post-infection.
Fig.2
Fig.2
TEM analysis of serial sections of infected PtK2 cells fixed by plunge freezing, freeze substituted and embedded in Lowicryl. PtK2 cells grown under FCS deprivation were infected with vaccinia virus and plunge frozen after 18 h post-infection. The samples were freeze-substituted and embedded in Lowicryl resin to collect thin sections following planes parallel to the cell-grid surface. The left panels show different sections of a cell at different heights (labeled in each image). N marks the position of the cell nucleus. The right panel shows a high magnification image of a typical cell revealing good preservation of the cytoplasm. F, ER and M mark the position of filaments, endoplasmic reticulum and mitochondria, respectively.
Fig.3
Fig.3
Workflow for cryo X-ray nano-tomography data acquisition: From live MVA-C-ΔF1L-GFP infected cells to X-ray projection images. (a) Live optical diffraction interference contrast image of infected cells growing on HZB2 Au-grids over formvar-carbon foil. (b) Live optical fluorescence image of the same area in (a). Cell membranes are red labeled (WGA dye) showing cell boundaries and uninfected cells. In green, viral expression of GFP showing the localization of infected cells. Scale bar represents 100 microns. Magnification is equal in (a) and (b). (c) Cryo-optical fluorescent image (GFP detection) of the same cell enclosed by a yellow square in (a) and (b) collected with the fluorescence microscope integrated in the TXM. (d) Cryo X-ray microscopy projection image (zone plate objective with drn = 40 nm, effective pixel size 15.6 nm) of the cell area marked in (c). (e) Cryo X-ray microscopy projection image of the yellow square enclosed area in (d) (zone plate objective with drn = 40 nm, effective pixel size 8.6 nm).
Fig.4
Fig.4
Comparison of infected PtK2 cellular ultrastructure by X-ray tomography and TEM freeze substitution and epoxy-resin sectioning. The left panels (a–d) represent planes of the X-ray tomographic reconstructions. The central panels (e–h) are TEM images of sections from freeze-substituted and Lowicryl embedded cells. Right panels (i–l) show TEM images of chemically fixed and contrasted epoxy-resin sections. Upper panels (a, e and f) compare the filaments (F) found in the basal part of the cell. (b, f and j) show the nuclear envelope and chromatin condensations, where N marks the position of the nucleus. (c, g and k) show mitochondria (M). The lower panels (d, h and l) show endoplasmic reticulum (ER). Scale bars represent 0.5 microns.
Fig.5
Fig.5
Comparison of viral structures in infected PtK2 cells by X-ray tomography and TEM freeze substitution and epoxy-resin sectioning. Left panels (a–b) represent planes of the X-ray tomographic reconstructions. The central panels (c–d) are TEM images of sections from freeze-substituted and Lowicryl embedded cells. Right panels (e–f) show TEM images of chemically fixed and contrasted epoxy-resin sections. Upper panels (a, c and e) compare a cellular overview where it is possible to detect the viral factories, enclosed by doted lines. N and PM mark the position of the nucleus and plasma membrane, respectively. Scale bars represent 2 microns. (b, d and f) are high magnification images of the infected cells cytoplasms where different viral structures are found. The insets in every panel show immature virions (IV) and mature viral particles (MV). M marks the position of mitochondria. Scale bars represent 0.5 microns.
Fig.6
Fig.6
Detection of different viral forms in MVA-C-ΔF1L-GFP infected PtK2 cells by cryo X-ray nano-tomography. Panel (a): Basal tomographic plane of a reconstructed cell by cryo X-ray nano-tomography. N marks the position of the nucleus, IV and MV the relative positions of the different immature and mature viral particles, respectively. Scale bar represents 1 micron. (b) Upper tomographic plane of the same reconstruction as in (a). PM marks the position of the plasma membrane of the cell and MV points to the mature viral particles. The scale is the same as in (a). (c) Formation of immature virions (IV) from viroplasm and crescents (VP). Scale bar represents 0.5 microns. (d) Area of the cytoplasm showing immature particles (IV) close to mature virions (MV). (e) A group of densely packaged mature particles (MV). (f) Mature particles near the plasma membrane (PM) of the cell. Panels (c)–(d) have the same magnification.
Fig.7
Fig.7
Ultrastructure comparison after X-ray irradiation. HZB2 grids used for cryo X-ray tomography were subjected to freeze-substitution and embedding in Lowicryl resin. Areas containing irradiated and non-irradiated cells were identified based on grid marks and features. Thin sections were obtained by ultramicrotomy and observed by electron microscopy. (a) .Cell section from a non-irradiated area. N marks the position of the nucleus, VF marks a viral factory. Scale bar represents 2 microns. (b) Higher magnification detail of the cytoplasm from (a). C shows a viral crescent, IV immature virus and MV mature virus. The left inset shows a magnified view of an IV, and the right inset a MV. Scale bar represents 500 nm. (c) Section of a heavily X-ray irradiated cell used to collect two full X-ray tomographic data sets. N marks the position of the nucleus, VF marks a viral factory. The scale is the same as in (a). (d) Higher magnification detail of the cytoplasm from (c). IV shows immature virus and MV mature virus. The left inset shows a magnified view of an IV, and the right inset a MV. Scale bar represents 500 nm.
Supplementary Fig. 1
Sample preparation for the TEM analysis of X-ray irradiated areas. Schematic diagram outlining the major preparation steps followed to study by transmission electron microscopy samples containing X-ray irradiated and non-irradiated areas. (a) Cells of interest from cultures grown on microscope grids (HZB2 Carbon-Formvar or HZB2 Carbon Au-grids) were first identified by fluorescence microscopy. (b) The cells were vitrified by plunge freezing in a Leica EM-CPC. (c) The frozen samples were X-ray-irradiated during tomographic data acquisition in selected areas (square 1), while other areas remained non-irradiated (square 2). (d) The grids containing those cells were freeze-substituted and embedded in acrylic resin Lowicryl HM23. After embedding, the blocks were turned down to facilitate the identification of selected cells using the marks in the grid (e). Then, the resin was carefully removed around the areas of interest, and these regions were cut out of the resin block (both for X-ray-irradiated (f) and non-irradiated (i) areas). During this process the metal grid was removed without damaging the block surface (g and j). The trimmed blocks containing the selected samples (1 and 2) were glued onto an Epon resin preformed bullet for ultrathin sectioning (h and k). The ultrathin sections were finally studied by electron microscopy.

References

    1. Agulleiro J.I., Fernandez J.J. Fast tomographic reconstruction on multicore computers. Bioinformatics. 2011;27:582–583. - PubMed
    1. Baumeister W., Steven A.C. Macromolecular electron microscopy in the era of structural genomics. Trends Biochem. Sci. 2000;25:624–631. - PubMed
    1. Carrascosa J.L., Chichon F.J., Pereiro E., Rodriguez M.J., Fernandez J.J., Esteban M., Heim S., Guttmann P., Schneider G. Cryo-X-ray tomography of vaccinia virus membranes and inner compartments. J. Struct. Biol. 2009;168:234–239. - PubMed
    1. Condit R.C., Moussatche N., Traktman P. In a nutshell: structure and assembly of the vaccinia virion. Adv. Virus Res. 2006;66:31–124. - PubMed
    1. Cyrklaff M., Risco C., Fernandez J.J., Jimenez M.V., Esteban M., Baumeister W., Carrascosa J.L. Cryo-electron tomography of vaccinia virus. Proc. Natl Acad. Sci. USA. 2005;102:2772–2777. - PMC - PubMed

Publication types

LinkOut - more resources