. 2012 Feb 15;318(4):326-35.
doi: 10.1016/j.yexcr.2011.11.014. Epub 2011 Dec 8.

Lactate is a mediator of metabolic cooperation between stromal carcinoma associated fibroblasts and glycolytic tumor cells in the tumor microenvironment

Affiliations

Lactate is a mediator of metabolic cooperation between stromal carcinoma associated fibroblasts and glycolytic tumor cells in the tumor microenvironment

Yanique I Rattigan et al. Exp Cell Res. .

Abstract

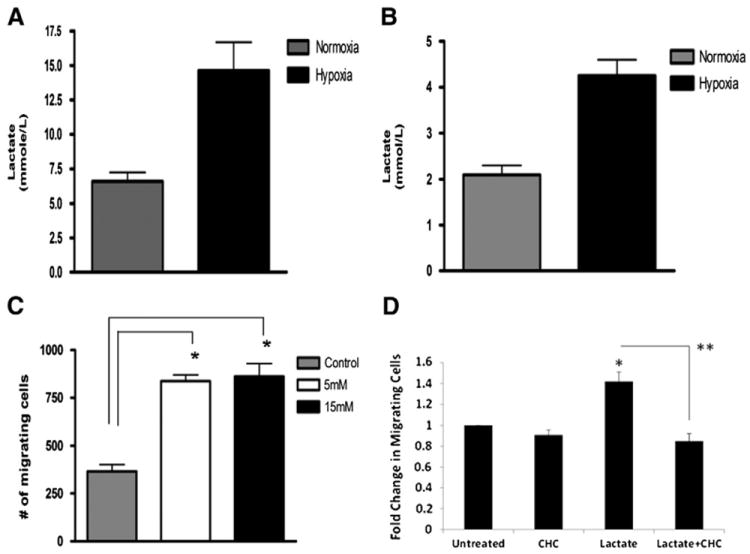
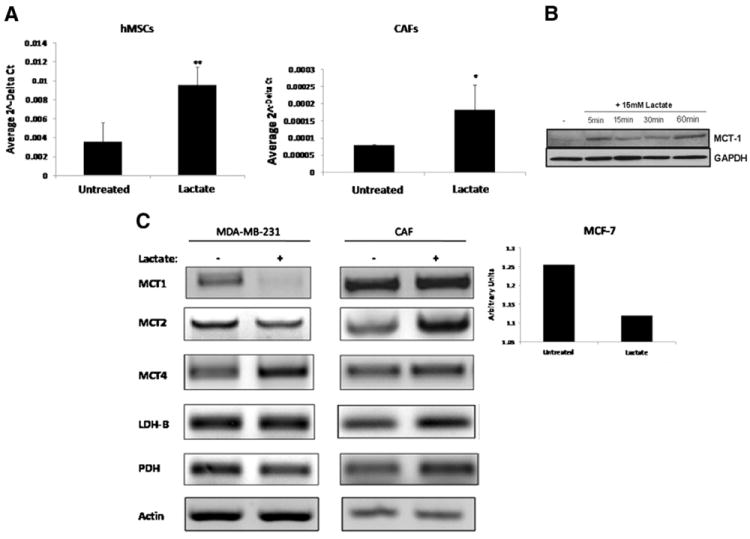
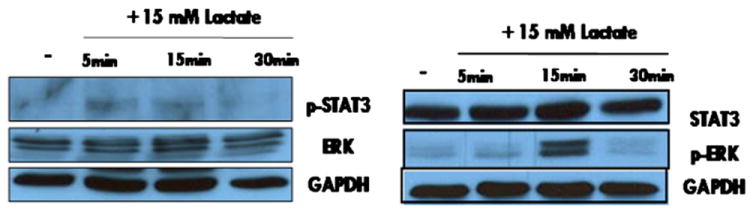
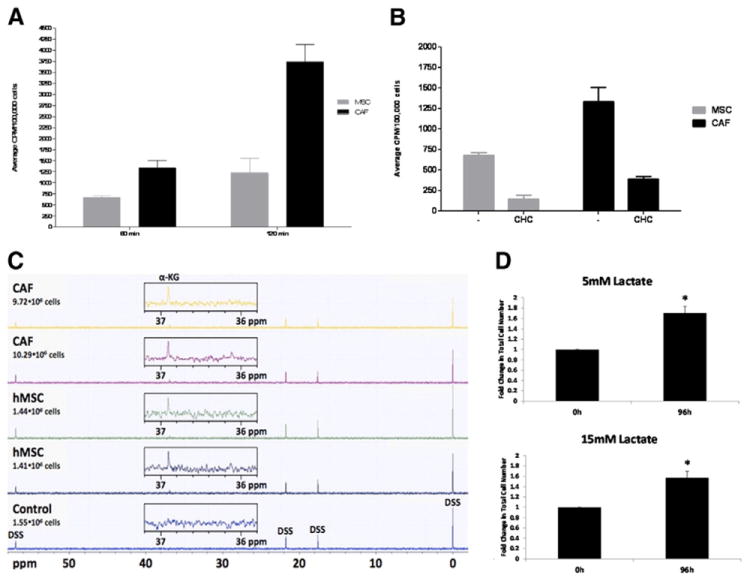
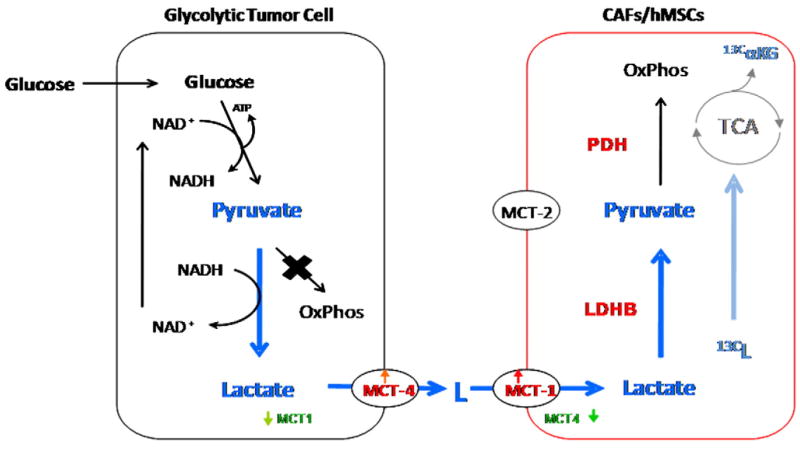
Human mesenchymal stem cells (hMSCs) are bone marrow-derived stromal cells, which play a role in tumor progression. We have shown earlier that breast cancer cells secrete higher levels of interleukin-6 (IL-6) under hypoxia, leading to the recruitment of hMSCs towards hypoxic tumor cells. We found that (i) MDA-MB-231 cells secrete significantly higher levels of lactate (3-fold more) under hypoxia (1% O(2)) than under 20% O(2) and (ii) lactate recruits hMSCs towards tumor cells by activating signaling pathways to enhance migration. The mRNA and protein expression of functional MCT1 in hMSCs is increased in response to lactate exposure. Thus, we hypothesized that hMSCs and stromal carcinoma associated fibroblasts (CAFs) in the tumor microenvironment have the capacity to take up lactate expelled from tumor cells and use it as a source of energy. Our (13)C NMR spectroscopic measurements indicate that (13)C-lactate is converted to (13)C-alpha ketoglutarate in hMSCs and CAFs supporting this hypothesis. To our knowledge this is the first in vitro model system demonstrating that hMSCs and CAFs can utilize lactate produced by tumor cells.


Figures

Fig. 1
Fig. 1
A, B: The breast cancer cell lines MDA-MB-231(A) and MCF-7 (B) secrete higher levels of lactate under hypoxia (1.5% O2) than normoxia (20% O2) (*p <0.05, unpaired t-test, n=3). Tumor cell-conditioned media (TCM) were collected after 24 h conditioning and levels of secreted lactate quantified using a lactate analyzer (Roche Diagnostics, Mannheim, Germany). C: Lactate stimulates hMSC migration. The migration of hMSCs towards culture media containing different doses of lactate, or control medium in 18 h was measured using a transwell migration assay. The number of migrating hMSCs towards lactate-containing culture medium was significantly higher than towards control medium (*p<0.05, unpaired t-test, n=4). D. CHC inhibits lactate-mediated increase in hMSC migration. The migration of untreated or CHC-treated hMSCs towards culture media containing 15 mM lactate, or control medium in 18 h was measured using a transwell migration assay. The number of migrating hMSCs for each condition was normalized to untreated controls. (*p<0.05, unpaired t-test, n=3, **p<0.005, paired, unequal variance t-test, n=3.)
Fig. 2
Fig. 2
A: MCT expression is induced upon lactate exposure. Quantitative real-time PCR revealed that MCT1 mRNA increased significantly in hMSCs (left panel) and in CAFs (right panel) exposed to 15 mM lactate for 1 h when compared to untreated control cells (p<0.05 as determined by 2-tailed, paired, t-test, n=3). B MCT1 protein is induced in MSCs exposed to 15 mM lactate. Western blot analysis shows increase in expression of MCT1 in MSCs over time periods of 5 to 60 min of lactate exposure. C: Left and center panel: MDA-MB-231 cells and CAFs were exposed to 15 mM lactate for 30 min following which RNA was isolated from each cell line and reverse transcribed for subsequent amplification by RT-PCR using primers specific for MCT1, MCT2, MCT4, LDH-A, LDH-B, and PDH. Expression of LDH-A remained unchanged (not shown) and β-actin served as internal control. Right panel: MCF-7 cells were exposed to 15 mM lactate for 30 min following which RNA was isolated and reverse transcribed for subsequent amplification by RT-PCR using primers specific for MCT1 and using β-actin as a control. Bar graph shows quantitation of the resulting MCT1 mRNA expression using Quantity One® 1-D Analysis Software as per manufacturer’s protocol (Bio-Rad). Data were normalized to untreated controls.
Fig. 3
Fig. 3
hMSCs were exposed to 15 mM lactate for 5, 15, and 30 min. Following each time point the lactate was removed. The reaction was terminated with ice-cold 1× PBS and hMSCs were lysed with 1× RIPA buffer. The protein concentration determined by Bradford assay and lysates ran on a 10% SDS-PAGE gel to analyze relative protein levels. Left panel: The protein levels of phosphorylated-STAT3 were induced in hMSCs upon exposure to 15 mM lactate. There was no change in the total expression levels of ERK. Right panel: 15 min exposure to 15 mM lactate activated phospho-ERK expression which reverted to basal levels after 30 min exposure to 15 mM lactate. There were no observable changes in the total protein levels of STAT3.
Fig. 4
Fig. 4
Lactate uptake in MSC and CAFs. Fig. 3A: CAFs exhibit higher uptake of lactate than hMSCs at 60 min and 120 min time points (p≤0.007 for 120 min time point and p<0.05 for 60 min time point, as determined by 2-tailed, unpaired, unequal variance t-test, n=3). 14C-lactate uptake was carried out in triplicate using hMSCs and CAFs. Numbers on Y-axis represent CPM per 1×10⁵ cells. Inhibition of 14C-lactate uptake by CHC indicates that 14C-lactate transport occurs via MCTs. Inhibition studies were carried out by incubating hMSCs and CAFs with 10 mM CHC for 1 h prior to the uptake studies. Significant inhibition of lactate transport was observed in presence of CHC in both cell types (p<0.005). C. Lactate is taken up and metabolized by hMSCs and CAFs as demonstrated from 13C NMR spectra of cell extracts. Two samples each of hMSCs and CAFs were incubated with 10 mM sodium-l-lactate-13C-3 for 4 h followed by PCA extraction. Proton-decoupled 13C NMR spectroscopy revealed 13C labeling of a metabolite, assigned to α-ketoglutarate-13C-3(α-KG), based on its 13C chemical shift [28], for all 4 samples (2 each for hMSCs and CAFs) incubated with 13C-labeled lactate but not in the untreated hMSC sample (control). An additional signal, detected in all samples outside of the spectral region shown here, was assigned to HCO3. D. hMSCs can survive and grow in lactate only media for an extended period of time. hMSCs were plated in 6 well plates in α MEM and 24 h later media was changed to αMEM depleted of glucose. Lactate was supplemented at 5 or 15 mM and cells allowed to grow for another 96 h in the modified medium. Plates were harvested at the end of 96 h and viable cells counted (p<0.05, n=3).
Fig. 5
Fig. 5
Model of metabolic cooperation between glycolytic tumor cells and stromal hMSCs/CAFs. Glucose is taken up by glycolytic tumor cells and converted to pyruvate to yield ATP at the cost of NAD+. As tumors preferentially utilize aerobic glycolysis over oxidative phosphorylation, this pyruvate is converted to lactate to replenish NAD+, thereby fueling further glycolysis. Tumor cells secrete the lactate via increased expression of lactate transporter MCT4. In response, MCT1 expression goes up in CAFs resulting in uptake of tumor-extruded lactate. Exposure to lactate increases expression of LDH-B in CAFs, resulting in the conversion of the influxed lactate to pyruvate. The pyruvate is shunted to the tricarboxylic acid cycle for ATP generation via oxidative phosphorylation, thereby satisfying the energetic needs of the CAFs.

References

    1. Kroemer G, Pouyssegur J. Tumor cell metabolism: cancer’s Achilles’ heel. Cancer Cell. 2008;13:472–482. - PubMed
    1. Warburg O. On respiratory impairment in cancer cells. Science. 1956;124:269–270. - PubMed
    1. Warburg O. On the origin of cancer cells. Science. 1956;123:309–314. - PubMed
    1. Deberardinis RJ, Sayed N, Ditsworth D, Thompson CB. Brick by brick: metabolism and tumor cell growth. Curr Opin Genet Dev. 2008;18:54–61. - PMC - PubMed
    1. Dang CV, Semenza GL. Oncogenic alterations of metabolism. Trends Biochem Sci. 1999;24:68–72. - PubMed

Publication types

MeSH terms