Meta-Analysis
. 2012 Apr;142(4):1021-1031.e15.
doi: 10.1053/j.gastro.2011.12.005. Epub 2011 Dec 13.

Genomic and genetic characterization of cholangiocarcinoma identifies therapeutic targets for tyrosine kinase inhibitors

Affiliations
Meta-Analysis

Genomic and genetic characterization of cholangiocarcinoma identifies therapeutic targets for tyrosine kinase inhibitors

Jesper B Andersen et al. Gastroenterology. 2012 Apr.

Abstract

Background & aims: Cholangiocarcinoma is a heterogeneous disease with a poor outcome that accounts for 5%-10% of primary liver cancers. We characterized its genomic and genetic features and associated these with patient responses to therapy.

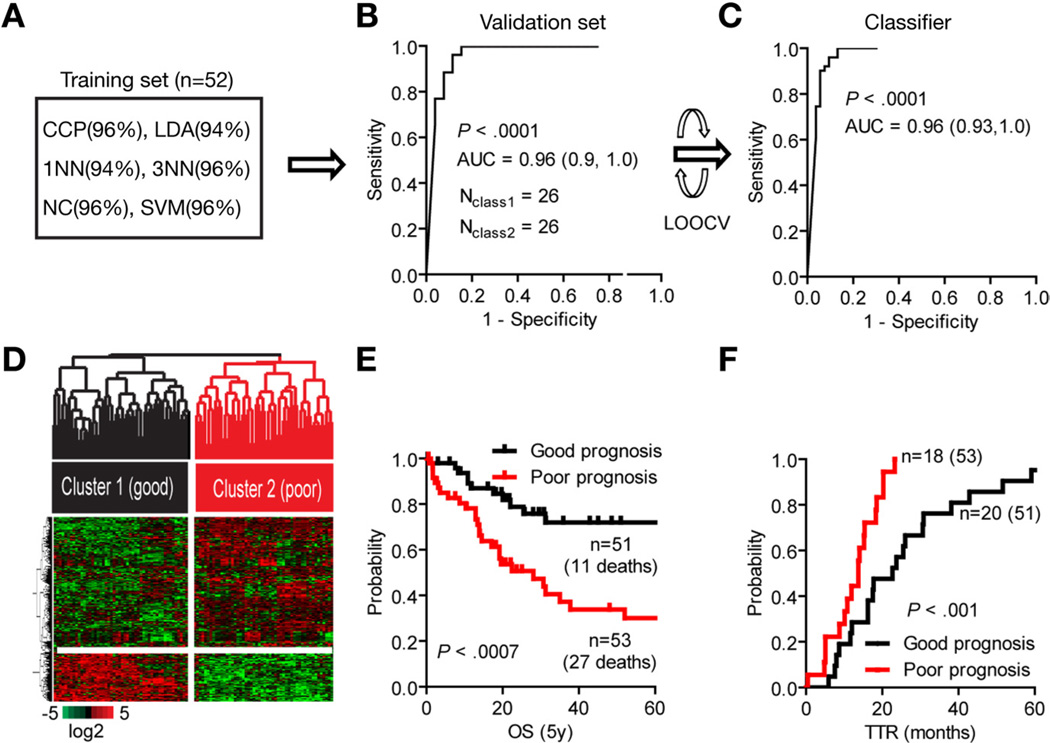
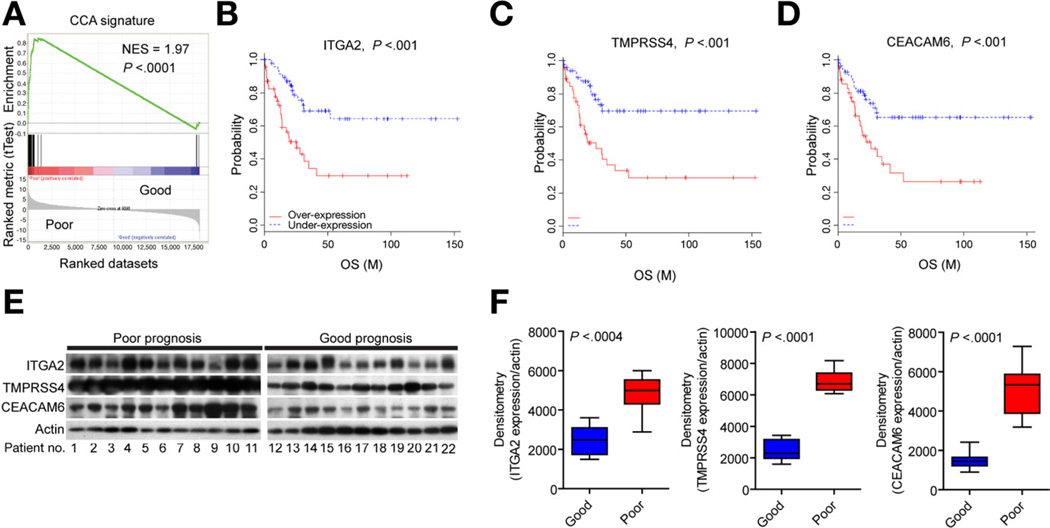
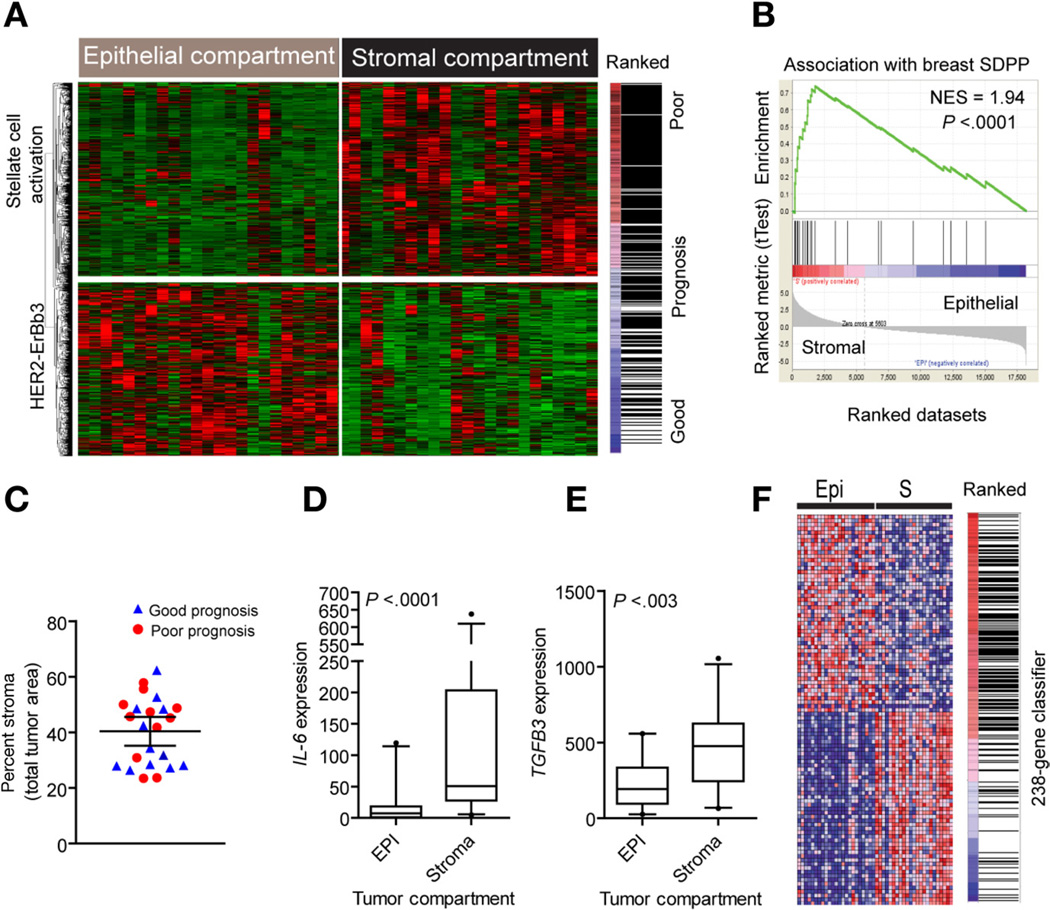
Methods: We profiled the transcriptomes from 104 surgically resected cholangiocarcinoma samples collected from patients in Australia, Europe, and the United States; epithelial and stromal compartments from 23 tumors were laser capture microdissected. We analyzed mutations in KRAS, epidermal growth factor receptor (EGFR), and BRAF in samples from 69 tumors. Changes in gene expression were validated by immunoblotting and immunohistochemistry; integrative genomics combined data from the patients with data from 7 human cholangiocarcinoma cell lines, which were then exposed to trastuzumab and lapatinib.

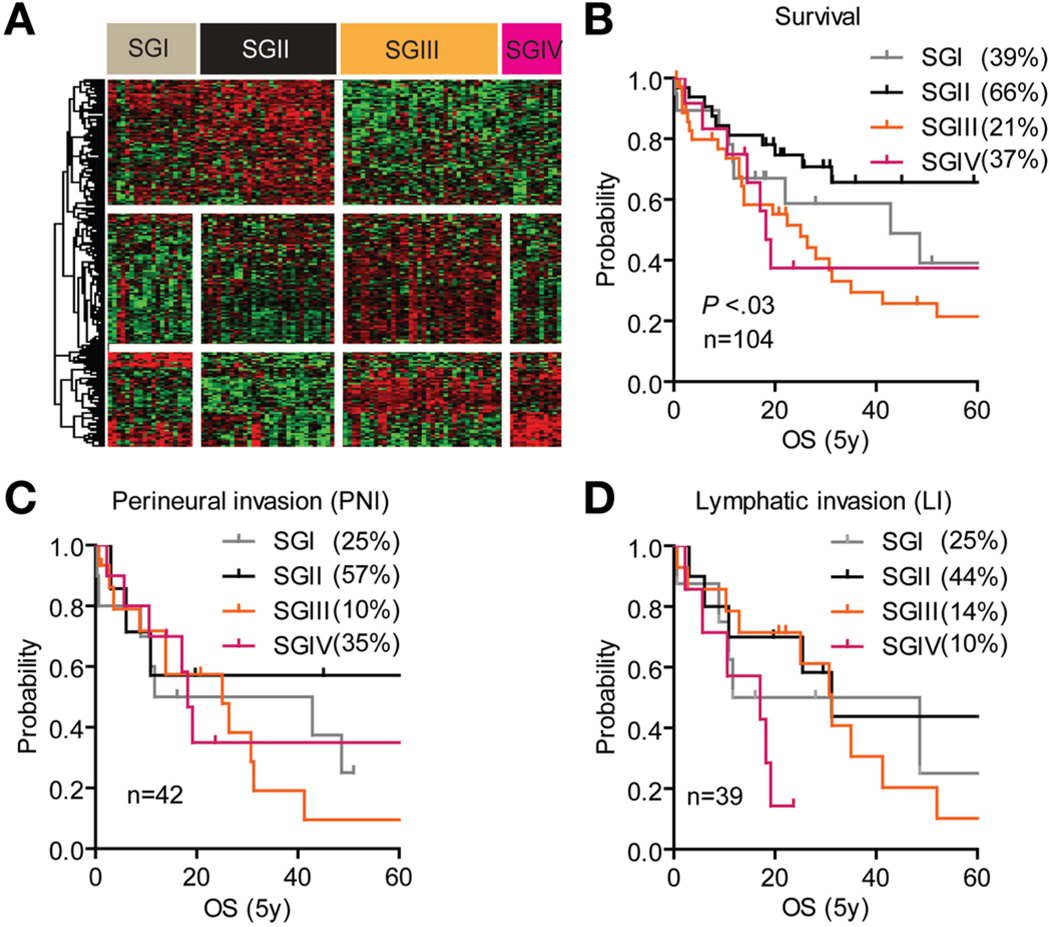
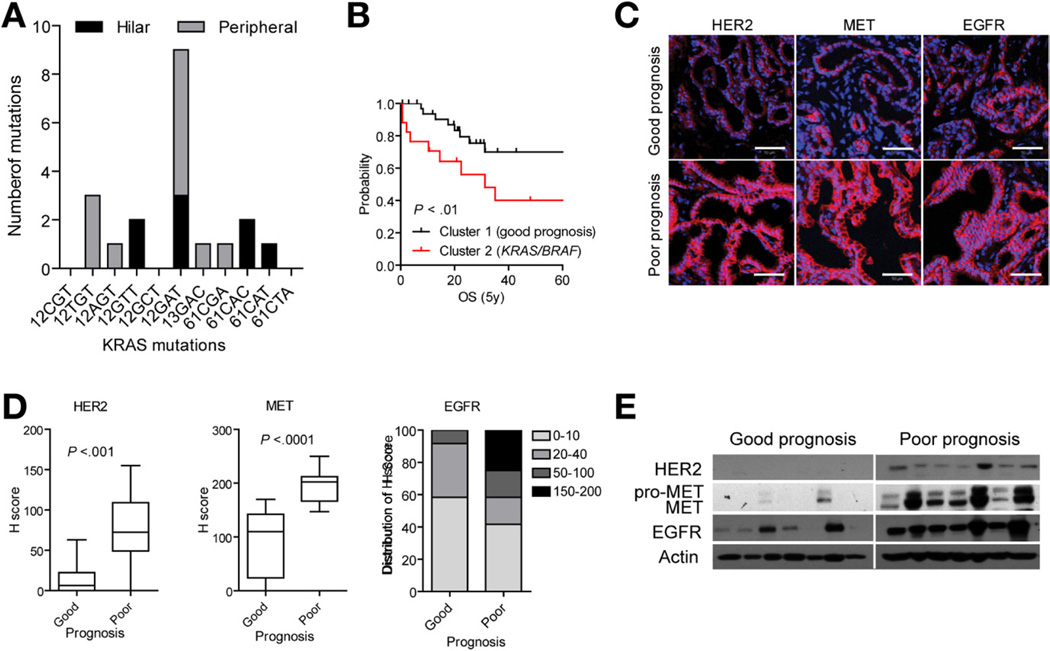
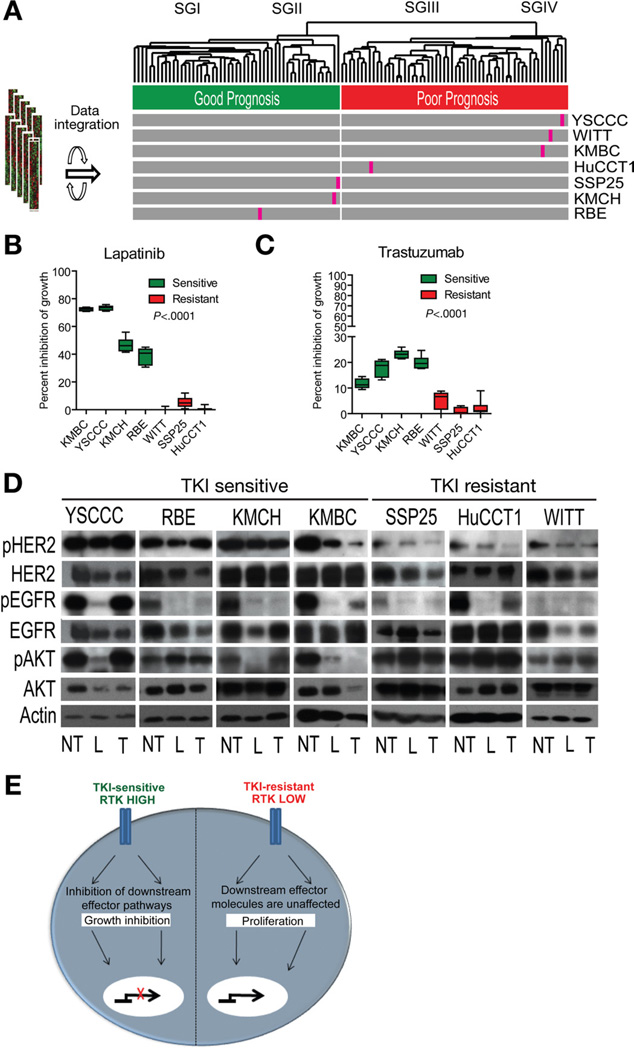
Results: Patients were classified into 2 subclasses, based on 5-year survival rate (72% vs 30%; χ(2) = 11.61; P < .0007), time to recurrence (13.7 vs 22.7 months; P < .001), and the absence or presence of KRAS mutations (24.6%), respectively. Class comparison identified 4 survival subgroups (SGI-IV; χ(2) = 8.34; P < .03); SGIII was characterized by genes associated with proteasomal activity and the worst prognosis. The tumor epithelium was defined by deregulation of the HER2 network and frequent overexpression of EGFR, the hepatocyte growth factor receptor (MET), pRPS6, and Ki67, whereas stroma was enriched in inflammatory cytokines. Lapatinib, an inhibitor of HER2 and EGFR, was more effective in inhibiting growth of cholangiocarcinoma cell lines than trastuzumab.

Conclusions: We provide insight into the pathogenesis of cholangiocarcinoma and identify previously unrecognized subclasses of patients, based on KRAS mutations and increased levels of EGFR and HER2 signaling, who might benefit from dual-target tyrosine kinase inhibitors. The group of patients with the worst prognosis was characterized by transcriptional enrichment of genes that regulate proteasome activity, indicating new therapeutic targets.


Conflict of interest statement

Conflicts of interest

The authors disclose no conflicts.

Figures

Figure 1
Figure 1
Development of a CCA gene classifier. (A) Multiple class comparison models were used to test the robustness of the classification in the training set (n = 52). (B) Sensitivity of the gene signature to correctly predict the classification of patients within the validation set (n = 52). The specificity is represented by the area under the receiver and operator curve (AUC, 95% CI) using Bayesian compound covariate predictor modeling. (C) Development of the gene classifier. To build the classifier, a class random variance model was used, identifying 238 genes significant at α ≤ .001 using Bayesian compound covariate modeling and leave-one-out cross-validation (LOOCV). (D) Hierarchical clustering of the 238-gene classifier separates patients into 2 subclasses according to their clinical outcome. (E) Analysis of survival (OS) and (F) time to recurrence (TTR). Kaplan–Meier and log-rank statistics were used to determine levels of significance.
Figure 2
Figure 2
Supervised class comparison identifies 4 subgroups. (A) Supervised hierarchical cluster analysis of 212 genes identified as differentially regulated between SGI and SGII (127 genes) and between SGIII and SGIV (85 genes). Class comparison using random variance modeling (10,000 permutations; P < .001) was used to identify the significant genes between the subgroups. (B–D) Analysis of (B) overall survival, (C) perineural invasion, and (D) lymphatic invasion as independent prognostic predictors within SGI–IV. Kaplan–Meier and log-rank statistics were used to determine levels of significance.
Figure 3
Figure 3
Prognostic survival genes. (A) GSEA of the classifier. Analysis of the survival genes revealed an ES of the rank-ordered genes, which showed a significant positive correlation with the poor survival subclass. The ES was normalized for the gene set (NES). (B–D) Genes significantly associated with the disease outcome were identified by means of a Cox proportional hazards model and Wald statistics. Thirty-six genes independently showed a prognostic ability at P < .01. (E and F) Representative Western blots of 3 survival genes, ITGA2, TMPRSS4, and CEACAM6, in resected tumor material from good and poor prognostic groups, respectively. Western blotting optical densities were normalized to β-actin values and expressed in arbitrary units. Bars represent mean ± 95% CI for each prognostic subtype (n = 11).
Figure 4
Figure 4
Analysis of the tumor microenvironment. (A) Unsupervised hierarchical clustering of epithelial and stromal cell compartments. Laser capture microdissection was used to isolate distinct cell populations from 23 tumors and identify gene expression differences. A total of 1442 genes were identified as differentially expressed between tumor epithelium and stroma by means of a paired bootstrap t test (P < .001). The stromal gene signature is enriched and associated with the group of patients with overall poor clinical outcome. (B) GSEA using a curated stromal gene set associated with overall poor prognosis in breast cancer. The 26-gene stromal-derived prognostic predictor (SDPP) was significantly enriched and positively associated with the stromal cell compartment in CCA. (C) Quantification of the epithelial-to-stromal composition given as a percent stromal area. The prognostic classification is given as good (blue) and poor (red) survival classes. (D and E) Analysis of (D) IL-6 and (E) TGFB3 gene expression in the tumor epithelial and stromal compartments (n = 23), respectively. Statistical significance was determined by Mann–Whitney test (2 tailed). The box plots show the mean, and whiskers are given for the 5th to 95th percentiles. (F) Association of the 238-gene classifier with the epithelial cell compartment. Hierarchical clustering of the top 50 ranked genes shows the enrichment and positive association with the tumor epithelium.
Figure 5
Figure 5
Characterization of the CCA classification. (A) Frequency of the KRAS mutations in codon 12, 13, and 61 detected by real-time quantitative polymerase chain reaction. The number of mutations is grouped according to hilar (black) and peripheral (gray) tumor subtype. (B) Survival analysis. The mutational status of KRAS/BRAF was significantly associated with poor prognosis as represented by Kaplan–Meier plots and log-rank statistics. (C) Immunohistochemical analysis of HER2, MET, and EGFR protein. Representative images are shown. Scale bar = 50 µm. (D) Semiquantitative assessment of immunohistochemical staining by H-score for HER2, MET, and EGFR. The box plots show the mean H-scores in good and poor prognosis tumor groups (n = 12 each), and whiskers are given for 5th to 95th percentiles. (E) Western blot analysis of HER2, MET, and EGFR expression in 7 patients from each of the prognostic subclasses. Actin was used as loading control.
Figure 6
Figure 6
Effect of TKIs in CCA. (A) Integration of 7 human CCA cell lines with the patient cohort using the 238-gene classifier. (B and C) Effect of a 7-day treatment with (B) lapatinib and (C) trastuzumab on the viability of CCA cell lines using an estimated 50% lethal dose for lapatinib or 500 µg/mL trastuzumab, respectively, for each cell line. Bars represent 8 experiments as mean ± 95% CI viability expressed as percent versus corresponding controls. The statistical significance was determined by one-way analysis of variance with Tukey’s multiple comparison tests (α = .05). (D) Western blot analysis of drug-target EGFR, HER2, and downstream AKT following treatment with lapatinib (L), trastuzumab (T), and untreated control (NT), respectively. (E) Schematic representation of TKI response. TKI-sensitive CCA cell lines have high level and activity of EGFR and HER2 expression. Downstream AKT signaling is unaffected in TKI-resistant CCA cell lines.

Comment in

References

    1. El-Serag HB, Rudolph KL. Hepatocellular carcinoma: epidemiology and molecular carcinogenesis. Gastroenterology. 2007;132:2557–2576. - PubMed
    1. DeOliveira ML, Cunningham SC, Cameron JL, et al. Cholangiocarcinoma: thirty-one-year experience with 564 patients at a single institution. Ann Surg. 2007;245:755–762. - PMC - PubMed
    1. Deoliveira ML, Schulick RD, Nimura Y, et al. New staging system and a registry for perihilar cholangiocarcinoma. Hepatology. 2011;53:1363–1371. - PubMed
    1. Aljiffry M, Walsh MJ, Molinari M. Advances in diagnosis, treatment and palliation of cholangiocarcinoma, 1990–2009. World J Gastroenterol. 2009;15:4240–4262. - PMC - PubMed
    1. Glimelius B, Hoffman K, Sjoden PO, et al. Chemotherapy improves survival and quality of life in advanced pancreatic and biliary cancer. Ann Oncol. 1996;7:593–600. - PubMed

Publication types

MeSH terms