. 2011 Dec 18;44(1):101-5.
doi: 10.1038/ng.1034.

Evolutionary paths to antibiotic resistance under dynamically sustained drug selection

Affiliations

Evolutionary paths to antibiotic resistance under dynamically sustained drug selection

Erdal Toprak et al. Nat Genet. .

Abstract

Antibiotic resistance can evolve through the sequential accumulation of multiple mutations. To study such gradual evolution, we developed a selection device, the 'morbidostat', that continuously monitors bacterial growth and dynamically regulates drug concentrations, such that the evolving population is constantly challenged. We analyzed the evolution of resistance in Escherichia coli under selection with single drugs, including chloramphenicol, doxycycline and trimethoprim. Over a period of ∼20 days, resistance levels increased dramatically, with parallel populations showing similar phenotypic trajectories. Whole-genome sequencing of the evolved strains identified mutations both specific to resistance to a particular drug and shared in resistance to multiple drugs. Chloramphenicol and doxycycline resistance evolved smoothly through diverse combinations of mutations in genes involved in translation, transcription and transport. In contrast, trimethoprim resistance evolved in a stepwise manner, through mutations restricted to the gene encoding the enzyme dihydrofolate reductase (DHFR). Sequencing of DHFR over the time course of the experiment showed that parallel populations evolved similar mutations and acquired them in a similar order.


Figures
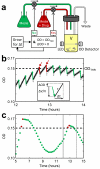
Figure 1
Figure 1. The morbidostat is a continuous-culture device that automatically tunes drug concentration to maintain constant growth inhibition
a, The assay runs in cycles of growth periods (Δt = 11 minutes) and dilutions with either fresh media (green) or drug solution (red). The population is diluted with antibiotic solution when OD exceeds ODTHR (0.15) and the net growth over the complete cycle is positive (ΔOD>0). b, Representative bacterial growth in the morbidostat. OD is recorded at 1Hz (plotted at 0.1Hz, grey dots). Growth rates (r) within growth periods are calculated by fitting exponential growth functions (black lines). Red and green markers in panels a and b indicate dilutions with drug solution and fresh media, respectively. c, Representative bacterial growth and inhibition in the morbidostat for an extended time period. Only final OD within growth cycles are plotted for clarity. Grey rectangle delimits data shown in panel b. Red circles show the cycles after which drug solution were added.
Figure 2
Figure 2. Parallel populations reach high level of resistance in similar adaptive trajectories
a, Sample measurements of OD versus time (circles) and fitted growth rates (exponential fit, color represent normalized growth rate r/r0) of the ancestral strain in different trimethoprim concentrations. b, Normalized growth rates of bacterial populations obtained from daily samples (x-axis) of the evolving populations in a range of fixed drug concentrations (y-axis). Day 0 corresponds to the ancestral strain before evolution. IC50 values are represented with black circles (r/r0=0.5). c-e, Resistance levels over time for parallel populations evolving under trimethoprim (c), chloramphenicol (d) and doxycycline (e) inhibition. Resistance increases by ~1680, 870 and 10 fold, respectively. Trimethoprim resistance increases in a stepwise fashion. The resistance data for each of the 15 populations is derived from high-throughput phenotyping as demonstrated in panel a (The TMP-1 population of panel c is the one represented in panel b, black circles).
Figure 3
Figure 3. Distinct and common genetic changes revealed by whole-genome sequencing
a, Single Nucleotide Polymorphisms (SNPs) confirmed by Illumina and Sanger sequencing. The horizontal arrow blocks and rectangles represent the coding and noncoding regions of genes respectively. SNPs found in 15 populations are shown by different symbols with colors indicating the drug applied during evolution (red: chloramphenicol, green: doxycycline, blue: trimethoprim). Note that SNPs found in multiple populations are shown with vertically stacked symbols appended to the genes. The SNPs fall in three major functional groups: (1) transcription and translation, (2) folic acid biosynthesis, and (3) membrane proteins. Arrow thickness reflects the frequency of mutations occurring within each functional group when the bacterial populations were challenged with the specified drugs. b, Resistance levels (of Illumina sequenced clones) to chloramphenicol, doxycycline, and trimethoprim. Black dotted lines indicate MIC for the ancestral strain. Diagonal panels (highlighted in color) represent evolved strains’ MIC values for the drugs they evolved against. Strains evolved against chloramphenicol exhibit elevated doxycycline resistance, and vice versa, while evolution under trimethoprim inhibition leads to little or no cross-resistance with either doxycycline or chloramphenicol.
Figure 4
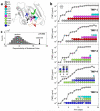
Figure 4. Semi-ordered acquisition of trimethoprim resistance mutations
a, Structure of E. Coli DHFR enzyme (1RX2.pdb) bound to its substrate, dihydrofolate (black, arrow), mutated residues shown in color (legend). b, IC50 values (gray lines) and time-resolved genetic changes in DHFR for each of the five replicate (TMP 1-5). For each day, mutations found in 4 randomly sampled clones are represented by a column of pie charts whose color and shape indicate the mutated residue and replacement amino acid, respectively (panel a, legend). For each mutation, the quadrants of the pie chart indicate the presence (filled) or absence (empty) of this mutation in each of the 4 sequenced clones (the correspondence between clones and quadrants is conserved across all mutations, to indicate whether mutations are found on the same or different clones). Colors of the mutated sites and the pie charts are independent from colors in previous figures. (Inset) (TMP-4), Additional colonies were sequenced from days 8-10 to verify the disappearance of W30C. c, Reproducibility of the order of fixation of mutations between the 5 parallel populations in the observed data (arrow) and when the order of mutations is randomly permuted (bar histogram). Only 0.2% of randomly permuted trajectories are equally or more reproducible than the observed trajectories shown in panel b.

References

    1. Weinreich DM, Delaney NF, Depristo MA, Hartl DL. Darwinian evolution can follow only very few mutational paths to fitter proteins. Science. 2006;312:111–4. - PubMed
    1. Lee HH, Molla MN, Cantor CR, Collins JJ. Bacterial charity work leads to population-wide resistance. Nature. 2010;467:82–5. - PMC - PubMed
    1. Lozovsky ER, et al. Stepwise acquisition of pyrimethamine resistance in the malaria parasite. Proc Natl Acad Sci U S A. 2009;106:12025–30. - PMC - PubMed
    1. Matthews DA, et al. Dihydrofolate reductase: x-ray structure of the binary complex with methotrexate. Science. 1977;197:452–5. - PubMed
    1. Schnell JR, Dyson HJ, Wright PE. Structure, dynamics, and catalytic function of dihydrofolate reductase. Annu Rev Biophys Biomol Struct. 2004;33:119–40. - PubMed

Publication types