Comparative Study
. 2011 Dec 18;9(2):159-72.
doi: 10.1038/nmeth.1808.

Principles for applying optogenetic tools derived from direct comparative analysis of microbial opsins

Affiliations
Comparative Study

Principles for applying optogenetic tools derived from direct comparative analysis of microbial opsins

Joanna Mattis et al. Nat Methods. .

Abstract

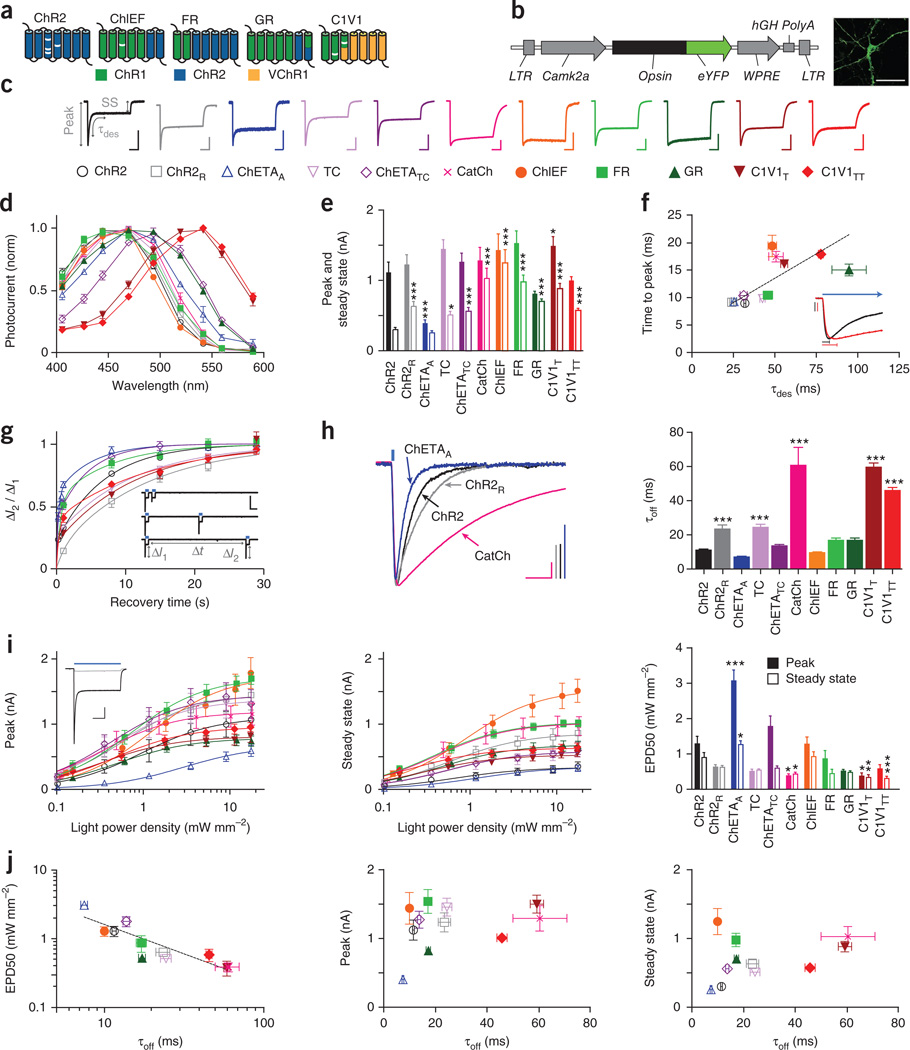
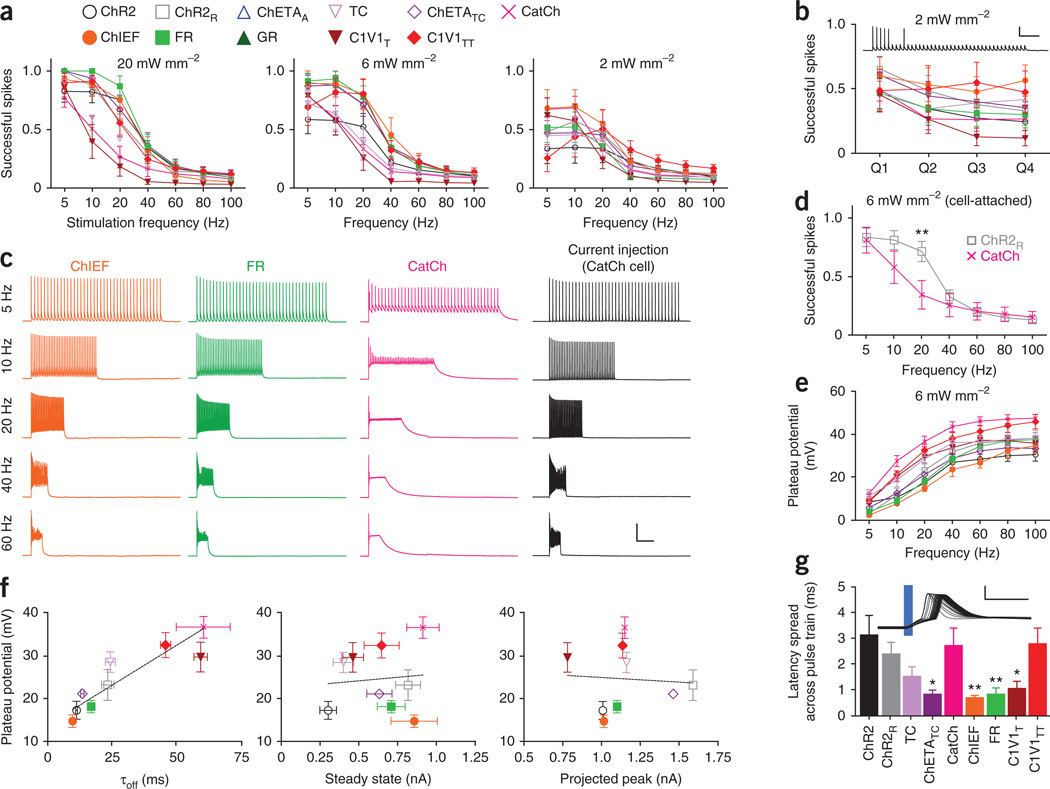
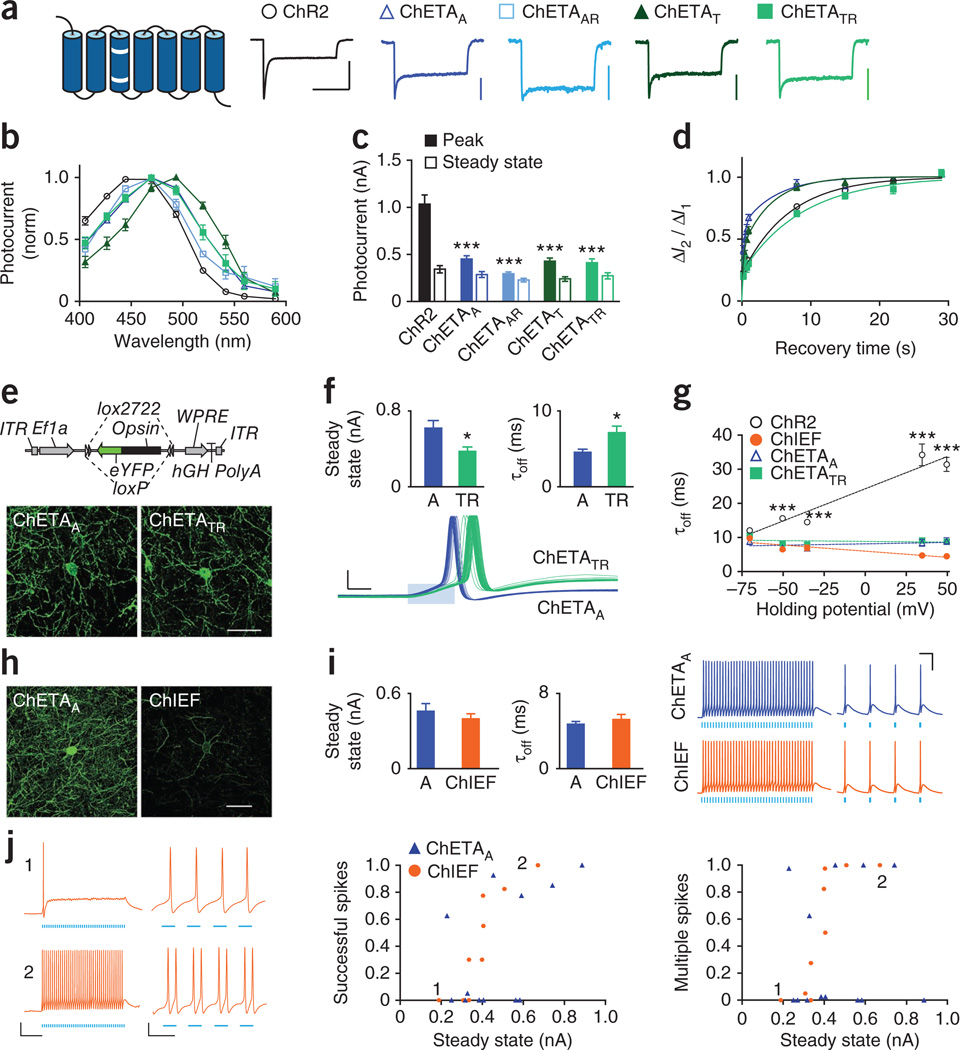
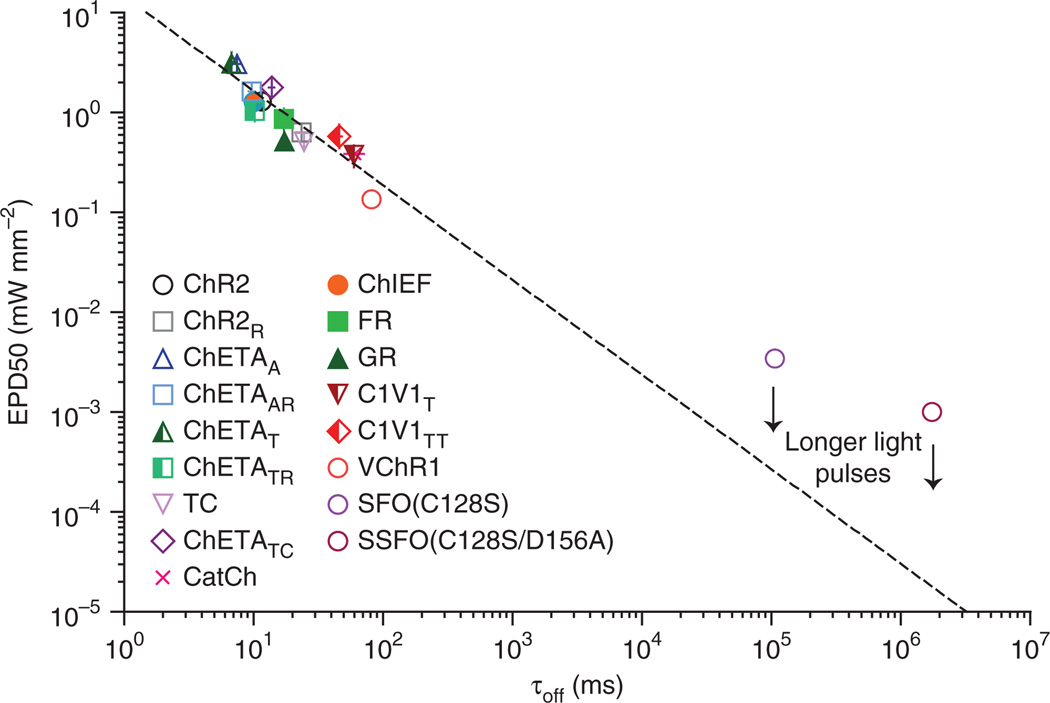
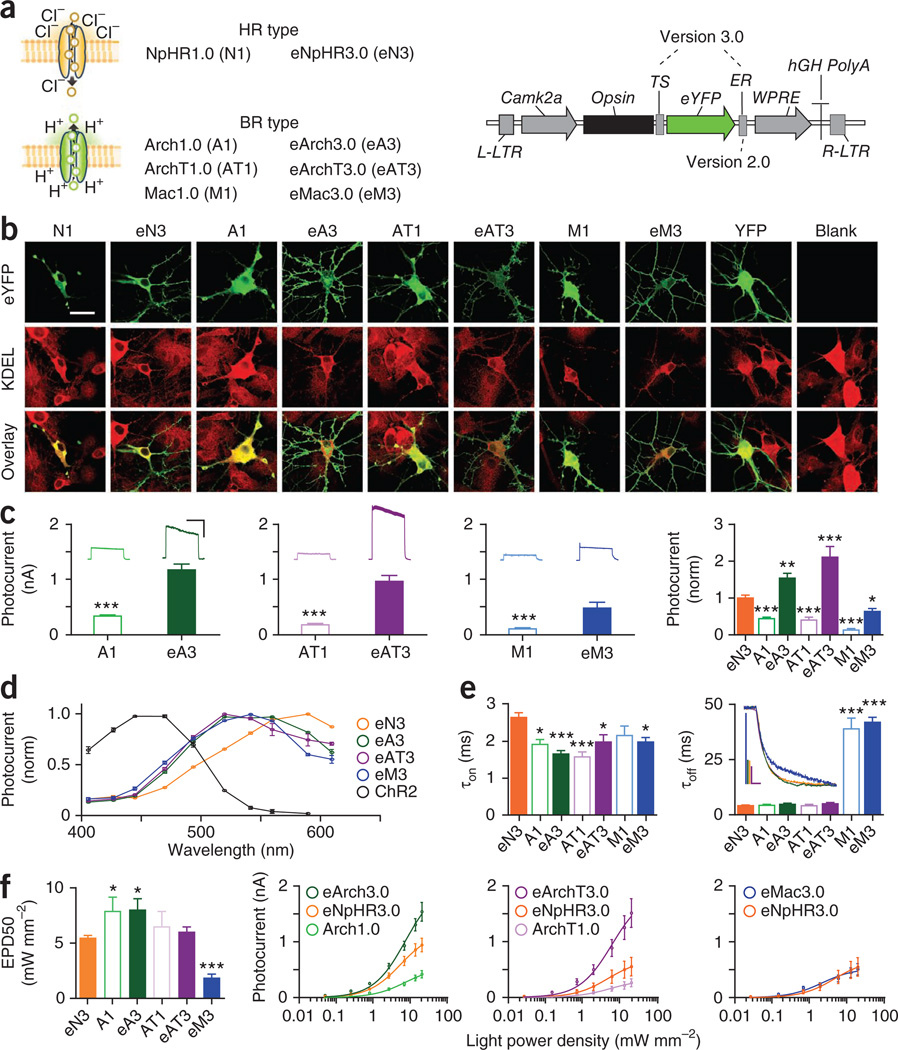
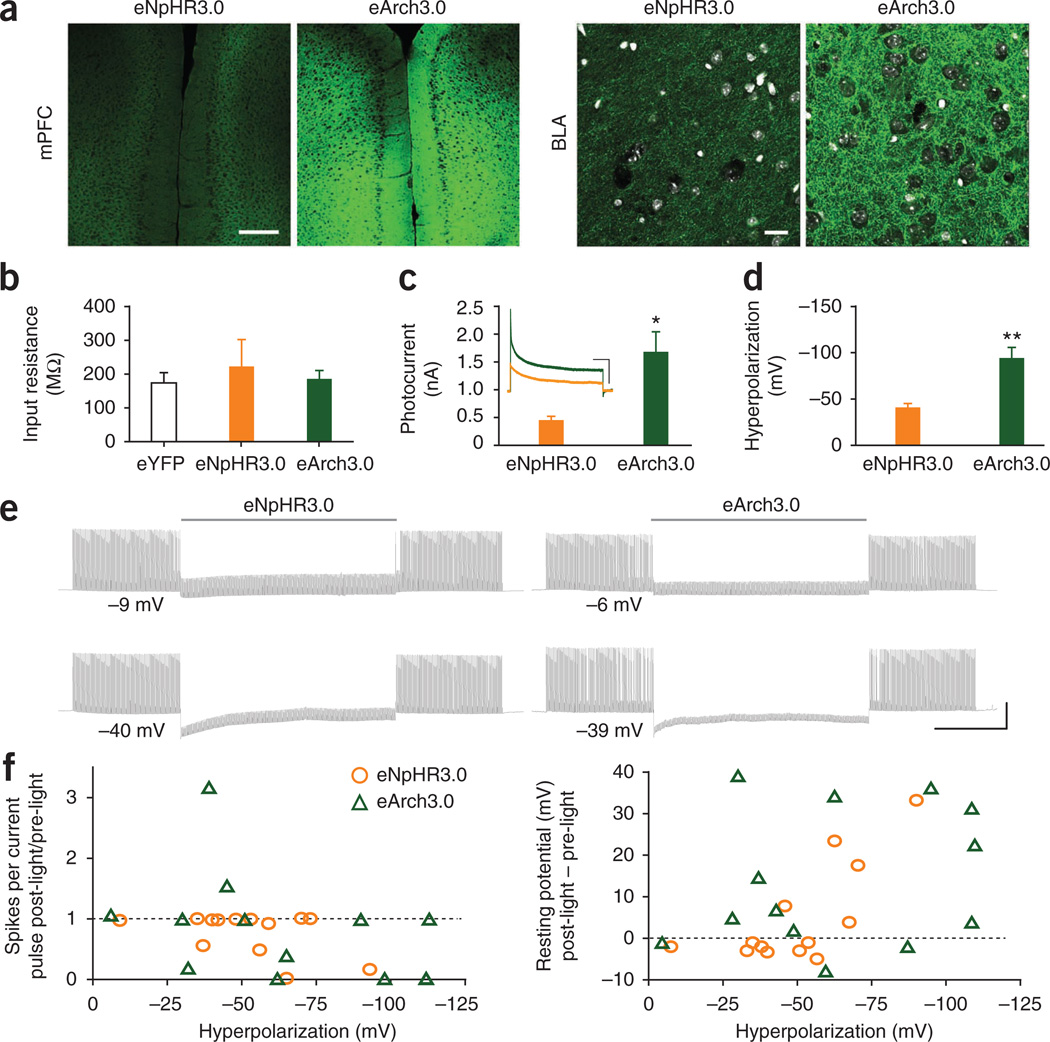
Diverse optogenetic tools have allowed versatile control over neural activity. Many depolarizing and hyperpolarizing tools have now been developed in multiple laboratories and tested across different preparations, presenting opportunities but also making it difficult to draw direct comparisons. This challenge has been compounded by the dependence of performance on parameters such as vector, promoter, expression time, illumination, cell type and many other variables. As a result, it has become increasingly complicated for end users to select the optimal reagents for their experimental needs. For a rapidly growing field, critical figures of merit should be formalized both to establish a framework for further development and so that end users can readily understand how these standardized parameters translate into performance. Here we systematically compared microbial opsins under matched experimental conditions to extract essential principles and identify key parameters for the conduct, design and interpretation of experiments involving optogenetic techniques.


Figures

Figure 1
Figure 1
Properties of depolarizing optogenetic tools. (a) Depolarizing tool classes. White bars indicate mutations. (b) Construct design and representative image for in vitro characterization. Scale bar, 50 µm. (c) Normalized representative photocurrents. Scale bars, 400 pA, 200 ms. Horizontal scale bar applies to all traces. Color and shape legend applies throughout the figure. (d) Action spectra (n = 5–11). (e) Peak (filled bars) and steady-state (hollow bars) photocurrents to 1 s light (n = 8–27). (f) Time to peak (n = 8–27) versus τdes (n = 8–50). Traces show normalized representative ChR2 (black) and C1V1TT (red) onset photocurrents. Vertical scale bars represent 200 pA, bars indicate time to peak, and blue arrow indicates ongoing light pulse. (g) Recovery from desensitization (n = 5–20). Vertical and horizontal scale bars represent 1 nA and 2 s. (h) Normalized representative traces and summary plots of τoff (n = 8–53). Scale bars, 200 pA and 25 ms. (i) Peak and steady-state photocurrents across light intensities. Inset, representative ChR2 photocurrents at low (light gray) versus high (dark gray) light intensity. Scale bars, 250 pA and 250 ms. EPD50 for peak (filled bars) and steady state (hollow bars) (n = 5–15). (j) τoff versus EPD50 and peak and steady-state photocurrents. All population data are plotted as mean ± s.e.m. *P < 0.05, **P < 0.01 and *** P < 0.001. Unless otherwise indicated, C1V1T and C1V1TT were activated with 560-nm light, and all other tools were activated with 470-nm light at ∼5 mW mm−2.
Figure 2
Figure 2
Performance of depolarizing tools. (a) Proportion of successfully evoked spikes (of 40 pulses; 5–100 Hz) at different light intensities (n = 8–18). Colors and shapes apply throughout the figure. (b) Temporal stationarity at 20 Hz, 2 mW mm−2(n = 8–18), based on the proportion of successful spikes in each quartile of pulses. Vertical and horizontal scale bars represent 40 mV and 1 s, respectively. (c) Representative evoked spiking across stimulation frequencies for ChIEF, FR and CatCh with closely matched ∼1.5 nA steady-state photocurrents at 6 mW mm−2. Vertical and horizontal scale bars represent 40 mV and 1 s, respectively. (d) Comparison of spiking performance between ChR2R (n = 19) and CatCh (n = 12) in cell-attached mode at 6 mW mm−2. (e) Plateau potential across pulse frequencies at 6 mW mm−2(n = 5–17). (f) Mean plateau potential for each opsin plotted against τoff, steady-state photocurrents and projected peak photocurrents. All values taken from the 6 mW mm−2 condition. (g) Latency spread across a pulse train, illustrated by representative traces of 40 consecutive ChR2 spikes in a train, aligned to the light pulse and overlaid. Vertical and horizontal scale bars represent 40 mV and 10 ms, respectively. All population data are plotted as mean ± s.e.m. *P < 0.05 and **P < 0.01. C1V1T and C1V1TT were activated with 560-nm light, and all other opsins were activated with 470-nm light.
Figure 3
Figure 3
Properties and performance of ultrafast depolarizing tools. (a) Schemata and normalized photocurrents for ChETAs and ChR2. White bars indicate mutations. Colors and shapes apply throughout the figure. Scale bars, 500 pA and 500 ms. Horizontal scale bar applies to all traces. (b) Action spectra (n = 5–12). (c) Peak (filled bars) and steady-state (hollow bars) photocurrents (n = 9–35). (d) Recovery from desensitization (n = 8–20). (e) ChETAA and ChETATR expression in fast-spiking neurons using a Cre recombinase-dependent strategy. Scale bar, 50 µm. (f) Steady-state photocurrents (n = 9),τoff n = 7), and consecutively evoked spikes for ChETAA and ChETATR (5 Hz, 2-ms light pulses). Scale bars, 20 mV and 1 ms. (g) τoff at −70 mV to +50 mV (n = 7–12). (h) ChETAA and ChIEF expression (scale bar, 50 µm). (i) Steady-state photocurrents (n = 9–13),τoff (n = 7), and evoked high and low frequency firing (200 Hz and 20 Hz). Scale bars, 25 mV and 25 ms. (j) ChIEF-expressing neurons with small (190 pA) or large (510 pA) photocurrents, under stringent or permissive conditions (1 ms or 5 ms pulse width). Vertical scale bar, 20 mV. Horizontal scale bars, 50 ms (left) and 10 ms (right). Spiking performance and multiple spike likelihood (under those same conditions) for all cells. All population data is plotted as mean ± s.e.m. *P < 0.05 and *** P < 0.001. Cells were illuminated with 470-nm light at ∼5 mW mm−2, unless otherwise specified.
Figure 4
Figure 4
Relationship between off kinetics and light sensitivity of optogenetic tools. Summary plot (on a log-log scale) of the relationship between τoff versus EPD50 for all depolarizing tools from Figures 1 and 3, plus VChR1, SFO(C128S) and SSFO(C128S/D156A). Dashed line represents best fit regression with R2 = 0.83; Spearman correlation coefficient R = −0.93, P < 0.001. Values for SFO and SSFO were estimated from previous publications, and did not contribute to the regression or correlation calculations.
Figure 5
Figure 5
Properties of hyperpolarizing tools. (a) NpHR is an inward chloride pump (halorhodopsin type; HR), whereas Arch, ArchT, and Mac are outward proton pumps (bacteriorhodopsin type; BR). The 3.0 versions include the endoplasmic reticulum export sequence (ER) after the fluorophore (which constitutes the 2.0 version) as well as a trafficking sequence (TS) between opsin and fluorophore. (b) Confocal images of 1.0 (the originally described version of the molecule) and 3.0 versions (green) expressed in culture and immunolabeled with an ER marker (KDEL; red). Scale bar, 25 µm. (c) Representative traces and raw photocurrents in response to 1 s light for 1.0 (open bars) versus 3.0 versions (closed bars) for Arch (n = 15–19), ArchT (n = 14–16) and Mac (n = 8–12). Vertical and horizontal scale bars represent 500 pA and 500 ms, respectively. Photocurrents were normalized to eNpHR3.0 values from within the same experiment to enable direct comparisons across opsins (n = 8–35). (d) Action spectra for 3.0 versions (n = 7–20) alongside ChR2 (black). (e) τon and τoff (n = 7–35). Vertical and horizontal scale bars represent 200 pA and 5 ms, respectively. (f) EPD50 values for all hyperpolarizing opsins (n = 5–14). Raw photocurrent versus light power density plotted alongside within-experiment eNpHR3.0 (n = 5–14). Population data are plotted as mean ± s.e.m. *P < 0.05, **P < 0.01 and ***P < 0.001. Unless otherwise indicated, eNpHR3.0 was activated with 590-nm light, and all other tools were activated with 560-nm light, both at ∼5 mW mm−2.
Figure 6
Figure 6
Performance of hyperpolarizing tools. (a) Confocal images of eNpHR3.0 and eArch3.0 expression at the injection site in medial prefrontal cortex (mPFC) and the downstream basolateral amygdala (BLA). Scale bars, 250 µm and 25 µm. DAPI staining (white) delineates cell bodies. (b) Mean input resistances for opsin-expressing cells and eYFP controls (n = 10–22). (c) Representative traces and mean onset photocurrents for eNpHR3.0 and eArch3.0 in response to 60 s 5 mW mm−2 light pulses (n = 8–10). Vertical and horizontal scale bars represent 400 pA and 10 s, respectively. (d) Mean peak hyperpolarization generated by eNpHR3.0 and eArch3.0 with 60 s 5 mW mm−2 light pulses (n = 6–10). (e) Suppression of current injection-evoked spiking in reliably firing cells by 60 s of continuous light in cells expressing eNpHR3.0 or eArch3.0. Cells were illuminated with light power densities set to achieve approximately matched hyperpolarization. Vertical and horizontal scale bars represent 40 mV and 20 s, respectively. (f) Relationship between hyperpolarization magnitude and cell stability. Post-light recovery of evoked spiking (relative to pre-light performance) and change in resting potential plotted against light-evoked hyperpolarization. Population data are plotted as mean ± s.e.m. *P < 0.05 and **P < 0.01. eNpHR3.0 was activated with 590-nm light, and eArch3.0 was activated with 560-nm light.

References

    1. Deisseroth K. Optogenetics. Nat. Methods. 2011;8:26–29. - PMC - PubMed
    1. Deisseroth K. Controlling the brain with light. Sci. Am. 2010;303:48–55. - PubMed
    1. Fenno L, Yizhar O, Deisseroth K. The development and application of optogenetics. Annu. Rev. Neurosci. 2011;34:389–412. - PMC - PubMed
    1. Yizhar O, Fenno LE, Davidson TJ, Mogri M, Deisseroth K. Optogenetics in neural systems. Neuron. 2011;71:9–34. - PubMed
    1. Wang C, Kane MA, Napoli JL. Multiple retinol and retinal dehydrogenases catalyze all-trans-retinoic acid biosynthesis in astrocytes. J. Biol. Chem. 2011;286:6542–6553. - PMC - PubMed

Publication types