. 2012 Feb 10;287(7):4628-39.
doi: 10.1074/jbc.M111.269480. Epub 2011 Dec 16.

Role of cyclophilin A from brains of prion-infected mice in stimulation of cytokine release by microglia and astroglia in vitro

Affiliations

Role of cyclophilin A from brains of prion-infected mice in stimulation of cytokine release by microglia and astroglia in vitro

Déborah Tribouillard-Tanvier et al. J Biol Chem. .

Abstract

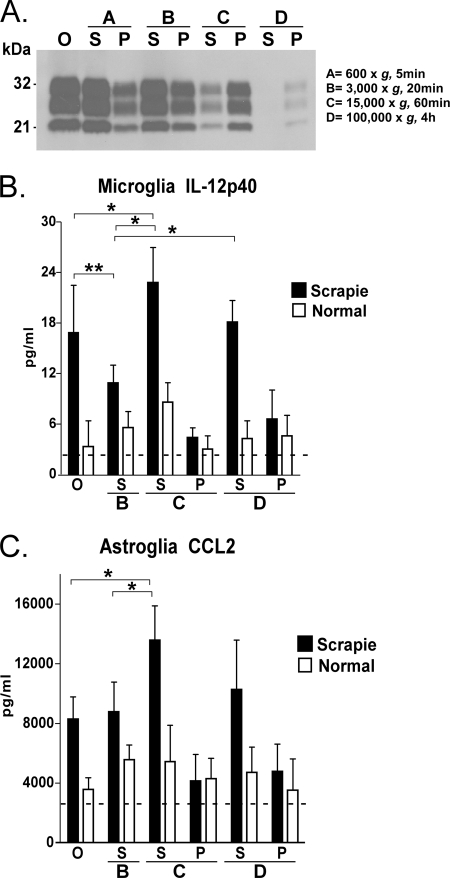
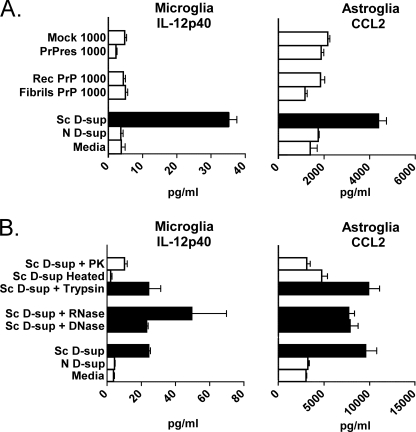
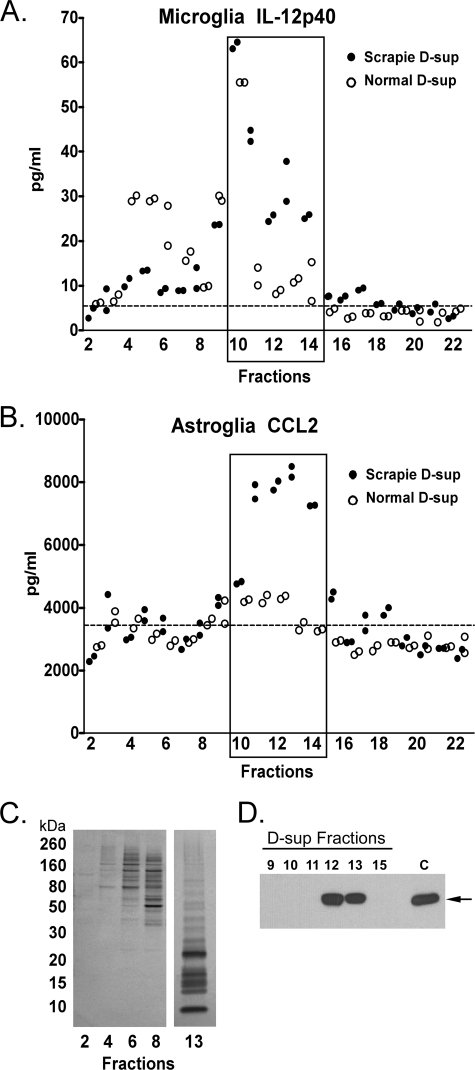
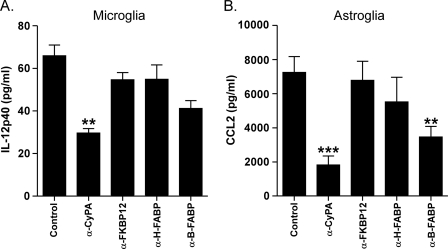
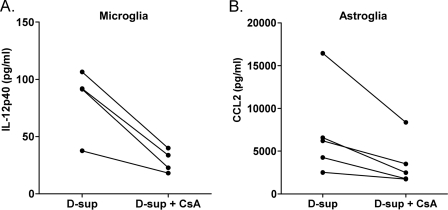
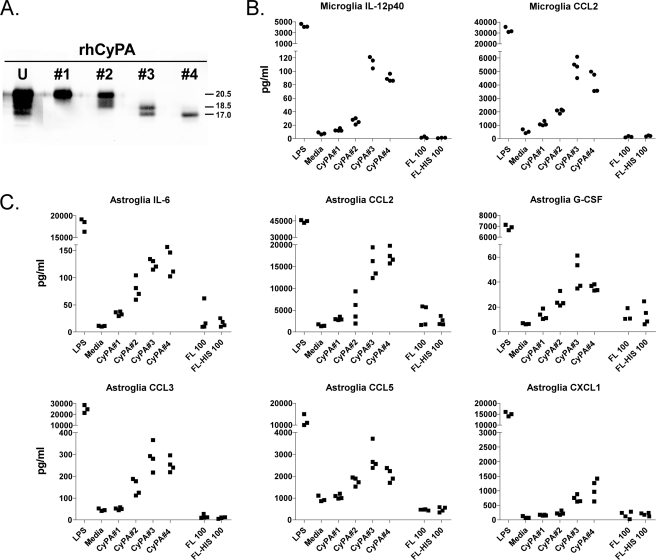
Prion diseases or transmissible spongiform encephalopathy diseases are typically characterized by deposition of abnormally folded partially protease-resistant host-derived prion protein (PrPres), which is associated with activated glia and increased release of cytokines. This neuroinflammatory response may play a role in transmissible spongiform encephalopathy pathogenesis. We previously reported that brain homogenates from prion-infected mice induced cytokine protein release in primary astroglial and microglial cell cultures. Here we measured cytokine release by cultured glial cells to determine what factors in infected brain contributed to activation of microglia and astroglia. In assays analyzing IL-12p40 and CCL2 (MCP-1), glial cells were not stimulated in vitro by either PrPres purified from infected mouse brains or prion protein amyloid fibrils produced in vitro. However, significant glial stimulation was induced by clarified scrapie brain homogenates lacking PrPres. This stimulation was greatly reduced both by antibody to cyclophilin A (CyPA), a known mediator of inflammation in peripheral tissues, and by cyclosporine A, a CyPA inhibitor. In biochemical studies, purified truncated CyPA fragments stimulated a pattern of cytokine release by microglia and astroglia similar to that induced by scrapie-infected brain homogenates, whereas purified full-length CyPA was a poor stimulator. This requirement for CyPA truncation was not reported in previous studies of stimulation of peripheral macrophages, endothelial cell cardiomyocytes, and vascular smooth muscle cells. Therefore, truncated CyPA detected in brain following prion infection may have an important role in the activation of brain-derived primary astroglia and microglia in prion disease and perhaps other neurodegenerative or neuroinflammatory diseases.


Figures

FIGURE 1.
FIGURE 1.
Fractionation of scrapie and normal brain homogenates by differential centrifugation. A, Western blot detection of PrPres in fractions from mouse brain infected by scrapie strain 22L. Each lane was loaded with 2 mg of tissue equivalents treated with proteinase K, and the blot was probed using the α-PrP antibody D13. O, the original scrapie brain homogenates without centrifugation; Fractions A–D are described under “Experimental Procedures.” S, supernatant of each fraction; P, pellet of each fraction. Cultured microglia (B) or astroglia (C) were stimulated by overlay with different fractions of scrapie-infected or uninfected normal brain homogenates made in DMEM-F-12 with 10% FBS. Supernatants were analyzed for IL-12p40 and CCL2 protein level by multiplex assay 24 h after stimulation. Values shown are means of the cytokine level detected minus the level contributed by the brain-derived overlay material from seven culture wells tested in several separate experiments on different days. Dotted lines show cytokine levels induced by medium alone. *, p = 0.05; **, p = 0.005. Brackets indicate S.E.
FIGURE 2.
FIGURE 2.
Evaluation of CCL2 and IL-12p40 release by microglia and astroglia in response to various stimuli. A, cultured microglia or astroglia were stimulated by overlay with amyloid-like fibrils derived from PrP expressed in E. coli (Fibrils PrP), monomeric non-fibrillar recombinant PrP(23–231) (Rec PrP) as a negative control, enriched PrPres from brains of C57BL/10 mice clinically infected with 22L strain of scrapie (PrPres), or mock control sample purified from normal uninfected brain homogenate (Mock). The figure shows results of tests at a stimulator concentration of 1000 ng/ml, but PrPres and PrP fibrils were also tested at several concentrations lower than 1000 ng/ml, and similar negative results were observed. Glial cells were also overlaid with medium alone or with 1% normal (N) D-sup as negative controls. White bars represent samples with significantly lower stimulation than 1% scrapie (Sc) D-sup, which was the positive control (black bars in A). B, cultured microglia or astroglia were stimulated by overlay with 1% scrapie D-sup treated either with 100 μg/ml DNase, 500 μg/ml RNase, 1 mg/ml trypsin, heat to 56 °C for 1 h, or 60 μg/ml proteinase K (PK). Medium alone or 1% normal D-sup in medium were the negative controls, whereas stimulation with 1% scrapie D-sup was the positive control. White bars in B indicate samples with significantly lower stimulation than positive control. All supernatants in A and B were analyzed by multiplex assay for IL-12p40 (microglia) or CCL2 (astroglia) 24 h after stimulation. Values shown are from 11 (A) or seven (B) culture wells tested in several separate experiments on different days. All p values in A were ≤0.005, and in B, p values were ≤0.05 when comparing scrapie D-sup treated or untreated with proteinase K or heat. Bars indicate the mean, and brackets represent the S.E.
FIGURE 3.
FIGURE 3.
Analysis of response of cultured microglia and astroglia to D-sup fractions. D-sup was fractionated into 22 fractions of 1 ml each by chromatography on a Superdex 200 column, and fractions were overlaid on cultured microglia (A) or astroglia (B). Each fraction was tested in duplicate at a final dilution of 1:4 in medium. Supernatants were analyzed for IL-12p40 and CCL2 release by multiplex assay 24 h after stimulation. The cytokine response to scrapie D-sup or normal D-sup are as indicated. Each circle represents an independent culture. The cytokine level after overlay with medium alone is represented by the dotted line. C, approximately 5 μg of total protein from representative fractions 2, 4, 6, 8, and 13 was separated by SDS-PAGE and stained with silver. Standards in kilodaltons (kDa) are on the left. Low molecular mass proteins under 30 kDa were abundant in the stimulating fractions (fractions 10–14), but proteins in the non-stimulating fractions (fractions 2–8) were mostly of higher molecular mass (>30 kDa). D, equal amounts of column fractions and control scrapie D-sup (indicated by the C) were separated by SDS-PAGE, transferred to PVDF, and probed with α-CyPA. The arrow identifies the 18-kDa band representing CyPA, which is enriched in fractions 11, 12, and 13. Note that the CyPA-immunoreactive band in fraction 11 was faint and required longer exposure to visualize.
FIGURE 4.
FIGURE 4.
Anti-cyclophilin A treatment of scrapie D-sup reduces cytokine release by glia. Cultured microglia (A) or astroglia (B) were stimulated by incubation with 1% scrapie D-sup with or without preincubation with 2 μg of α-CyPA, α-FK506-binding protein 12 (FKBP12), α-heart fatty acid-binding protein (H-FABP), α-brain fatty acid-binding protein (B-FABP), or control antibody (Control). Supernatants were analyzed by multiplex cytokine assay for IL-12p40 (microglia) and CCL2 (astroglia) 24 h after stimulation. α-CyPA significantly reduced both microglial release of IL-12p40 (**, p < 0.01) and CCL2 release by astroglia (***, p < 0.001). α-Brain fatty acid-binding protein also reduced CCL2 release by astroglia (**, p < 0.01). Results were compared by one-way analysis of variance with Dunnett's multiple comparison test. Bars indicate the means, and brackets represent the S.E.
FIGURE 5.
FIGURE 5.
Cyclosporine A treatment of scrapie D-sup reduces cytokine release by glia. Cultured microglia (A) or astroglia (B) were stimulated by incubation with 1% scrapie D-sup with or without preincubation with 0.1 μg/ml CsA. Supernatants were analyzed by multiplex cytokine assay for IL-12p40 (microglia) and CCL2 (astroglia) 24 h after stimulation. CsA was able to significantly reduce both microglial release of IL-12p40 (p < 0.028) and astroglial release of CCL2 (p < 0.049) when analyzed by paired t test. In this figure, for more accurate statistical analysis, data shown are raw cytokine levels without subtraction of brain homogenate backgrounds because background was the same in paired samples but differed slightly among the various pairs where different D-sups were used. CsA did not decrease LPS stimulation of astroglia and microglia (data not shown). CsA alone did not stimulate glial cells. Values from paired experiments are linked by a line.
FIGURE 6.
FIGURE 6.
Profile of cytokine expression in mouse glial cells exposed to normal D-sup versus scrapie D-sup. A, cultured microglia or astroglia were stimulated by incubation with 1% scrapie (Sc) D-sup, 1% normal (N) D-sup, or medium. Sups from cultures were tested in a 23-cytokine multiplex assay. The 23 cytokines tested were IL-1α, IL-1β, IL-2, IL-3, IL-4, IL-5, IL-6, IL-9, IL-10, IL-12p40, IL-12p70, IL-13, IL-17, IFN-γ, CCL11 (Eotaxin), G-CSF, GM-CSF, CXCL1 (KC), CCL2 (MCP-1), CCL3 (MIP-1α), CCL4 (MIP-1β), CCL5 (RANTES), and TNF. Four independent culture wells were tested. p values comparing scrapie versus normal D-sup for each panel shown were ≤0.05. Cytokines showing a response significantly above medium with at least one of the sample variables analyzed are included in the figure. B, cultured astroglia were stimulated by incubation with 1% normal D-sup or 1% normal D-sup preincubated either with 2 μg of α-CyPA antibody or 0.1 μg/ml CsA. p values comparing normal D-sup versus D-sup treated with α-CyPA or CsA were >0.05. Bars indicate the mean, and brackets represent the S.E.
FIGURE 7.
FIGURE 7.
Truncated forms of CyPA are present in scrapie brain D-sup. In the left panel, 5–40 μg of protein from scrapie D-sup or normal D-sup was separated by SDS-PAGE and analyzed by immunoblotting using α-CyPA. Truncated CyPA bands with molecular masses from 8 to 15 kDa were seen only in scrapie D-sup. In the right panel, an immunoblot with 20 μg of scrapie D-sup (Sc) or normal D-sup (N) was probed with α-CyPA preincubated with (+) or without (−) an antibody-blocking peptide CyPA p100–165 (pep) (Abcam). α-Actin reactivity, used as a loading control for both panels, is shown in the lower panels. Lane numbers for the individual immunoblots are indicated at the bottom of each panel.
FIGURE 8.
FIGURE 8.
Evaluation of CCL2 release by astroglia in response to scrapie-infected mouse brain homogenates from different times postinfection. Cultured astroglia were overlaid with a final concentration of 1.0% scrapie D-supernatants from mice harvested at 61, 83, 99, 115, 125, and 135 dpi (three mice per time point in duplicate). Astroglia were also overlaid with a final concentration of 1.0% mock-challenged normal brain homogenate D-supernatants (N D-sup) from mice sacrificed at 61 and 135 dpi (two mice per time point in duplicate), medium alone, or 1.0 μg/ml crude LPS as controls. CCL2 released from astroglia cultures was quantified by Bio-Plex assay after 24-h incubation. Astroglial release of CCL2 in response to scrapie (Sc) D-sups significantly exceeding controls was observed from 99 to 135 dpi and increased with time relative to normal brain homogenate D-supernatants or medium alone. Results were compared by one-way analysis of variance with Dunnett's multiple comparison test (* denotes p < 0.05, ** denotes p < 0.01, and *** denotes p < 0.001). Bars indicate the mean, and brackets represent the S.E.
FIGURE 9.
FIGURE 9.
Truncated forms of CyPA stimulate cytokine release by glial cells, but full-length CyPA does not. Two microliters of the eluted CyPA products from each rhCyPA fraction (fractions 1–4) was separated by SDS-PAGE and probed with α-CyPA (A) to determine the recovery relative to 1 μg of unfractionated rhCyPA (U) starting material (Abcam). Immunoreactive bands were visualized and quantified using the Li-Cor Odyssey imaging system and software. Relative molecular masses in kDa are marked to the right of the panel. Cultured microglia (B) or astroglia (C) were treated by overlaying with the different eluted rhCyPA fractions (fractions 1–4) at a concentration of 50 nm or with 100 nm untagged full-length (FL) CyPA (R&D Systems) or polyhistidine-tagged (N terminus) full-length (FL-HIS) CyPA (Sigma). Glial cells incubated with medium alone or 1 μg/ml LPS constituted negative and positive controls, respectively. Twenty-four hours after stimulation, supernatants from microglia and astroglia cultures were tested in a 9- or 23-cytokine multiplex assay. Cytokines showing a response significantly above medium with at least one of the CyPA samples analyzed are included in the figure. Each data point represents an individual culture well. In repeated assays using D-sup or rhCyPA products as stimulators of microglia and astroglia, cytokines CCL3, CCL5, and IL-13 were variable in statistical significance. This accounts for their variable presence in Figs. 6 and 9 and Table 2.

Similar articles

Cited by

References

    1. Prusiner S. B. (1991) Molecular biology of prion diseases. Science 252, 1515–1522 - PubMed
    1. Rock R. B., Gekker G., Hu S., Sheng W. S., Cheeran M., Lokensgard J. R., Peterson P. K. (2004) Role of microglia in central nervous system infections. Clin. Microbiol. Rev. 17, 942–964 - PMC - PubMed
    1. Burwinkel M., Riemer C., Schwarz A., Schultz J., Neidhold S., Bamme T., Baier M. (2004) Role of cytokines and chemokines in prion infections of the central nervous system. Int. J. Dev. Neurosci. 22, 497–505 - PubMed
    1. Ransohoff R. M., Perry V. H. (2009) Microglial physiology: unique stimuli, specialized responses. Annu. Rev. Immunol. 27, 119–145 - PubMed
    1. Brown G. C., Neher J. J. (2010) Inflammatory neurodegeneration and mechanisms of microglial killing of neurons. Mol. Neurobiol. 41, 242–247 - PubMed

Publication types

LinkOut - more resources