

Three-stage assembly of the cysteine synthase complex from Escherichia coli
- PMID: 22179612
- PMCID: PMC3281712
- DOI: 10.1074/jbc.M111.288423
Three-stage assembly of the cysteine synthase complex from Escherichia coli
Abstract
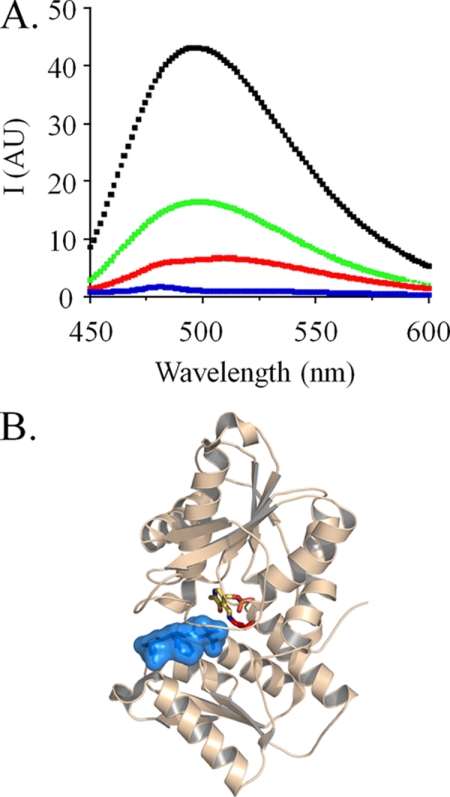
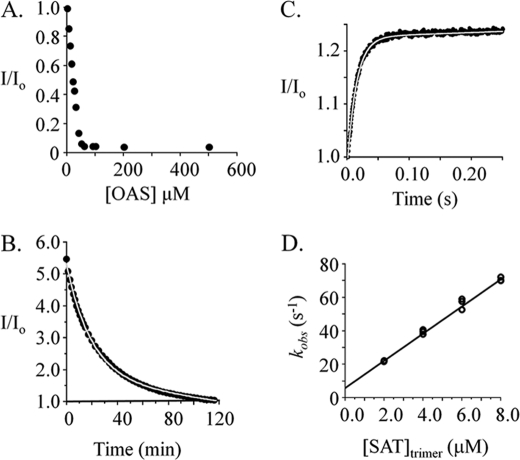
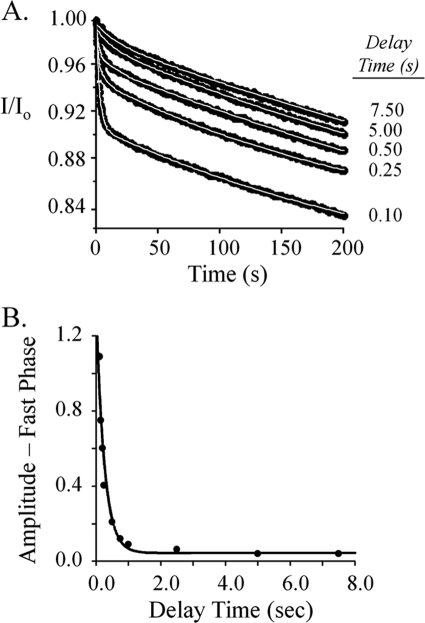
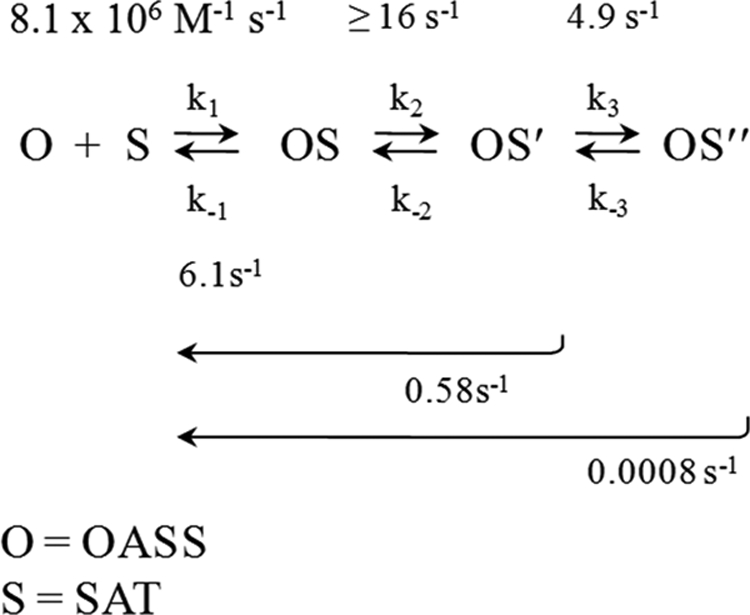
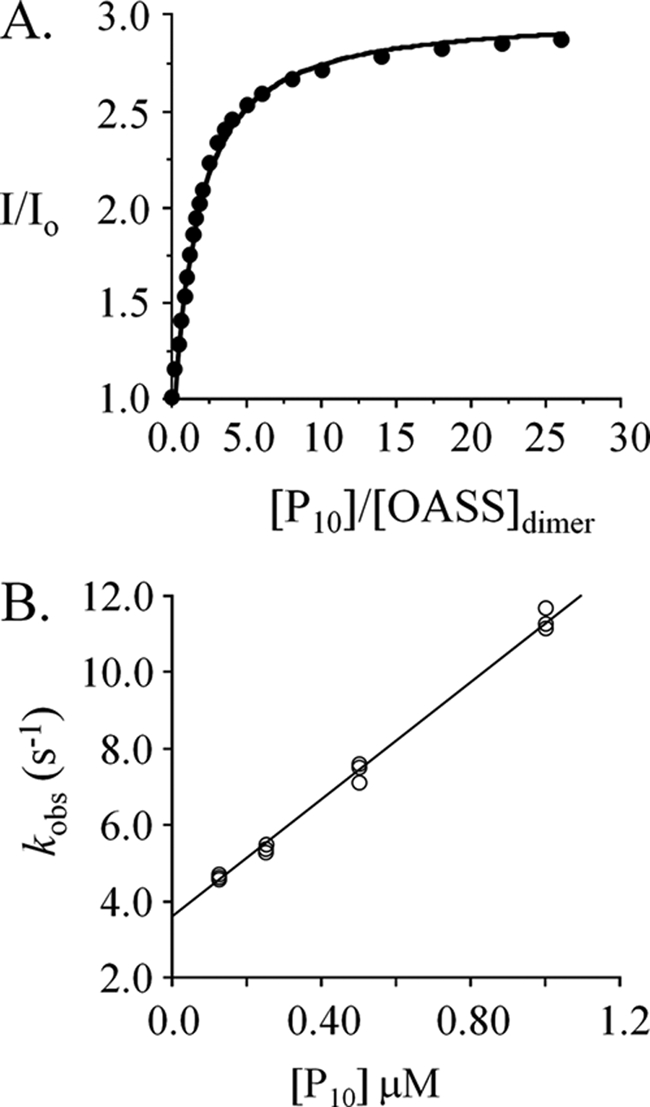
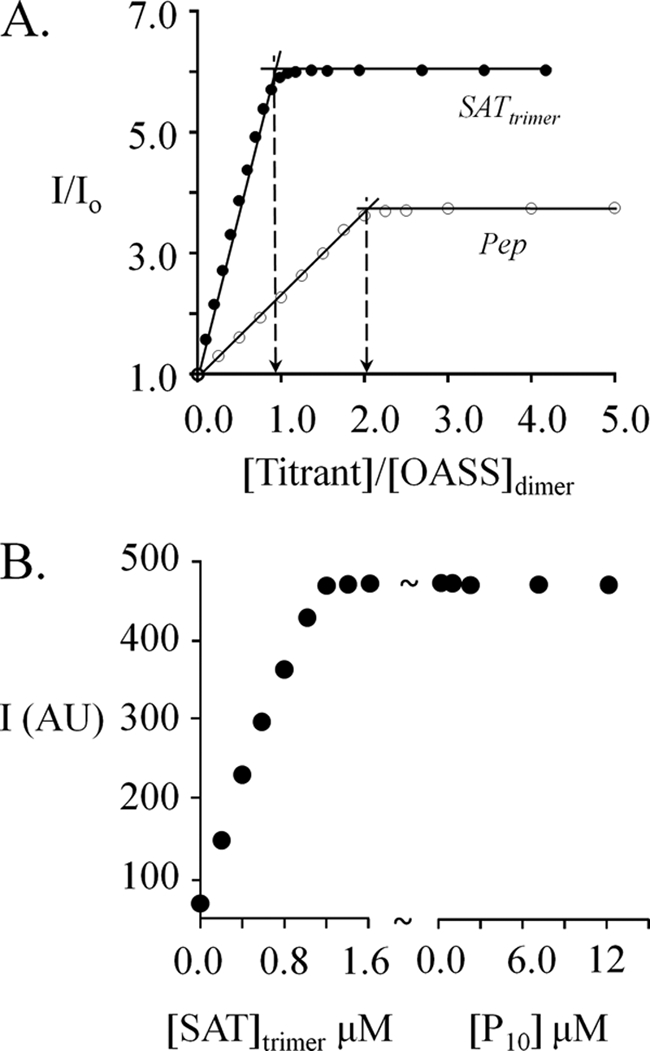
Control of sulfur metabolism in plants and bacteria is linked, in significant measure, to the behavior of the cysteine synthase complex (CSC). The complex is comprised of the two enzymes that catalyze the final steps in cysteine biosynthesis: serine O-acetyltransferase (SAT, EC 2.3.1.30), which produces O-acetyl-L-serine, and O-acetyl-L-serine sulfhydrylase (OASS, EC 2.5.1.47), which converts it to cysteine. SAT (a dimer of homotrimers) binds a maximum of two molecules of OASS (a dimer) in an interaction believed to involve docking of the C terminus from a protomer in an SAT trimer into an OASS active site. This interaction inactivates OASS catalysis and prevents further binding to the trimer; thus, the system exhibits a contact-induced inactivation of half of each biomolecule. To better understand the dynamics and energetics that underlie formation of the CSC, the interactions of OASS and SAT from Escherichia coli were studied at equilibrium and in the pre-steady state. Using an experimental strategy that initiates dissociation of the CSC at different points in the CSC-forming reaction, three stable forms of the complex were identified. Comparison of the binding behaviors of SAT and its C-terminal peptide supports a mechanism in which SAT interacts with OASS in a non-allosteric interaction involving its C terminus. This early docking event appears to fasten the proteins in close proximity and thus prepares the system to engage in a series of subsequent, energetically favorable isomerizations that inactivate OASS and produce the fully isomerized CSC.
Figures
Similar articles
-
Two Distinct Assembly States of the Cysteine Regulatory Complex of Salmonella typhimurium Are Regulated by Enzyme-Substrate Cognate Pairs.Biochemistry. 2017 May 9;56(18):2385-2399. doi: 10.1021/acs.biochem.6b01204. Epub 2017 Apr 21. Biochemistry. 2017. PMID: 28414426
-
Assembly of the cysteine synthase complex and the regulatory role of protein-protein interactions.J Biol Chem. 2009 Apr 10;284(15):10268-75. doi: 10.1074/jbc.M900154200. Epub 2009 Feb 11. J Biol Chem. 2009. PMID: 19213732 Free PMC article.
-
A two-step process controls the formation of the bienzyme cysteine synthase complex.J Biol Chem. 2010 Apr 23;285(17):12813-22. doi: 10.1074/jbc.M109.075762. Epub 2010 Feb 17. J Biol Chem. 2010. PMID: 20164178 Free PMC article.
-
The cysteine regulatory complex from plants and microbes: what was old is new again.Curr Opin Struct Biol. 2013 Apr;23(2):302-10. doi: 10.1016/j.sbi.2013.02.011. Epub 2013 Mar 17. Curr Opin Struct Biol. 2013. PMID: 23510784 Review.
-
Functional analysis of the cysteine synthase protein complex from plants: structural, biochemical and regulatory properties.J Plant Physiol. 2006 Feb;163(3):273-86. doi: 10.1016/j.jplph.2005.11.013. Epub 2005 Dec 28. J Plant Physiol. 2006. PMID: 16386330 Review.
Cited by
-
Combination of SAXS and Protein Painting Discloses the Three-Dimensional Organization of the Bacterial Cysteine Synthase Complex, a Potential Target for Enhancers of Antibiotic Action.Int J Mol Sci. 2019 Oct 21;20(20):5219. doi: 10.3390/ijms20205219. Int J Mol Sci. 2019. PMID: 31640223 Free PMC article.
-
Structure of Leishmania major cysteine synthase.Acta Crystallogr Sect F Struct Biol Cryst Commun. 2012 Jul 1;68(Pt 7):738-43. doi: 10.1107/S1744309112019124. Epub 2012 Jun 22. Acta Crystallogr Sect F Struct Biol Cryst Commun. 2012. PMID: 22750854 Free PMC article.
-
Isozyme-specific ligands for O-acetylserine sulfhydrylase, a novel antibiotic target.PLoS One. 2013 Oct 22;8(10):e77558. doi: 10.1371/journal.pone.0077558. eCollection 2013. PLoS One. 2013. PMID: 24167577 Free PMC article.
-
Sulfide Homeostasis and Nitroxyl Intersect via Formation of Reactive Sulfur Species in Staphylococcus aureus.mSphere. 2017 Jun 21;2(3):e00082-17. doi: 10.1128/mSphere.00082-17. eCollection 2017 May-Jun. mSphere. 2017. PMID: 28656172 Free PMC article.
-
The N-Terminus of Human Sulfotransferase 2B1b─a Sterol-Sensing Allosteric Site.Biochemistry. 2022 May 17;61(10):843-855. doi: 10.1021/acs.biochem.1c00740. Epub 2022 May 6. Biochemistry. 2022. PMID: 35523209 Free PMC article.
References
-
- Forquin M. P., Hébert A., Roux A., Aubert J., Proux C., Heilier J. F., Landaud S., Junot C., Bonnarme P., Martin-Verstraete I. (2011) Global regulation of the response to sulfur availability in the cheese-related bacterium Brevibacterium aurantiacum. Appl. Environ. Microbiol. 77, 1449–1459 - PMC - PubMed
Publication types
MeSH terms
Substances
Grants and funding
LinkOut - more resources
Full Text Sources
Molecular Biology Databases
Research Materials
