. 2011 Dec 18;19(1):31-9.
doi: 10.1038/nsmb.2192.

Signal-dependent dynamics of transcription factor translocation controls gene expression

Affiliations

Signal-dependent dynamics of transcription factor translocation controls gene expression

Nan Hao et al. Nat Struct Mol Biol. .

Abstract

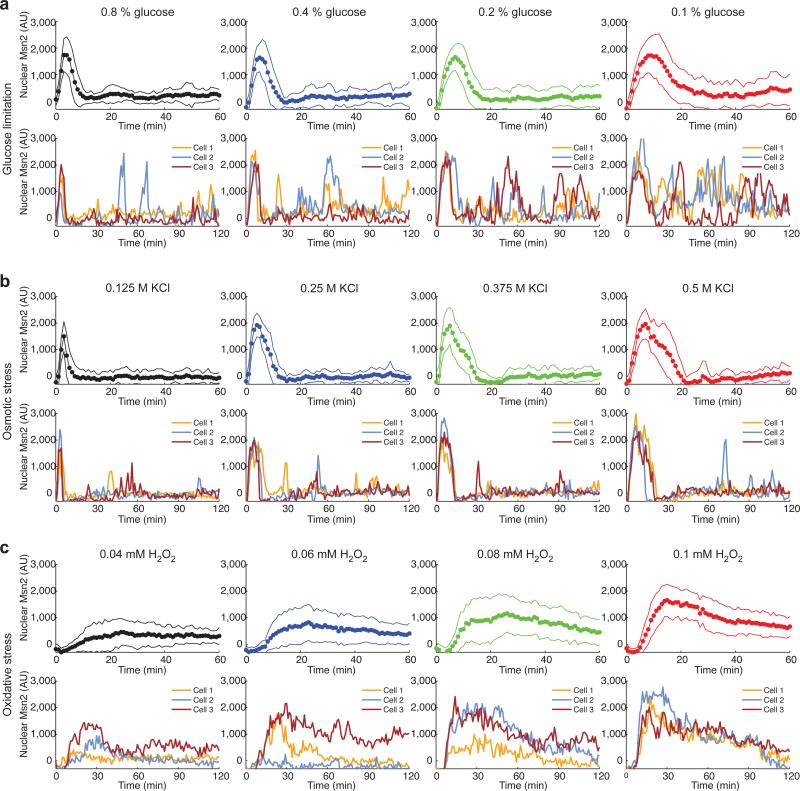
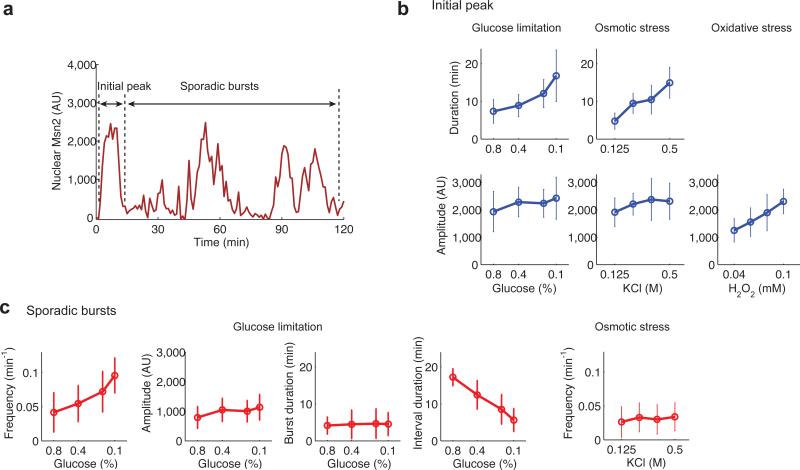
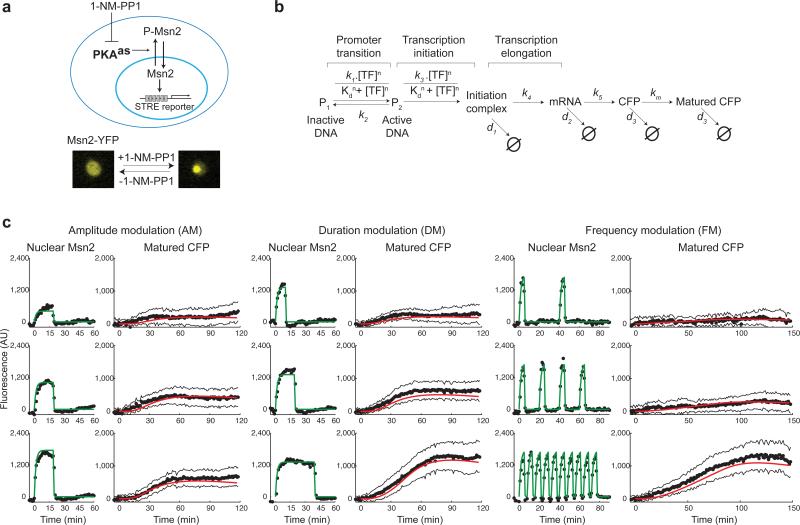
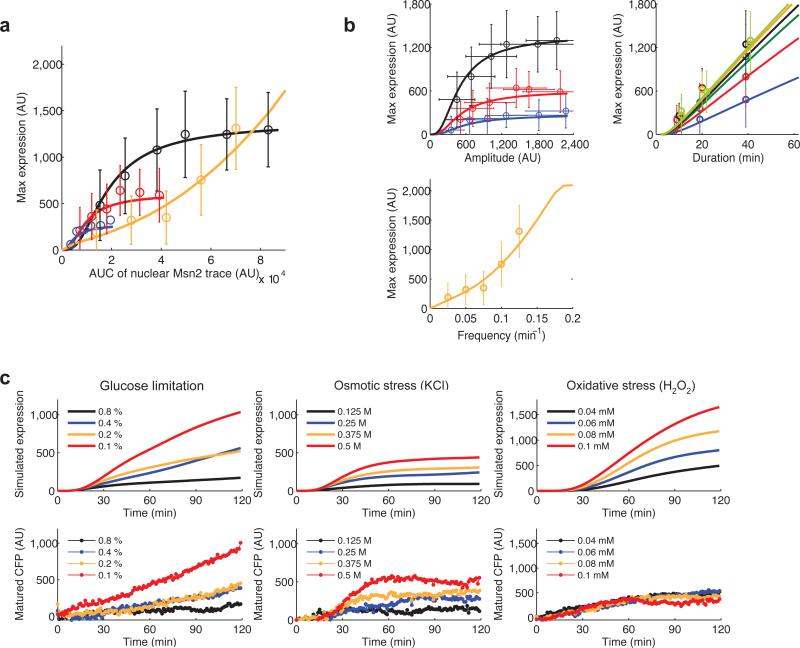
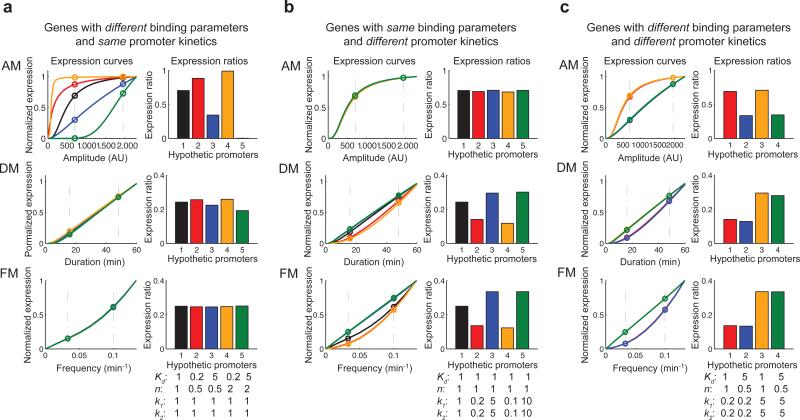
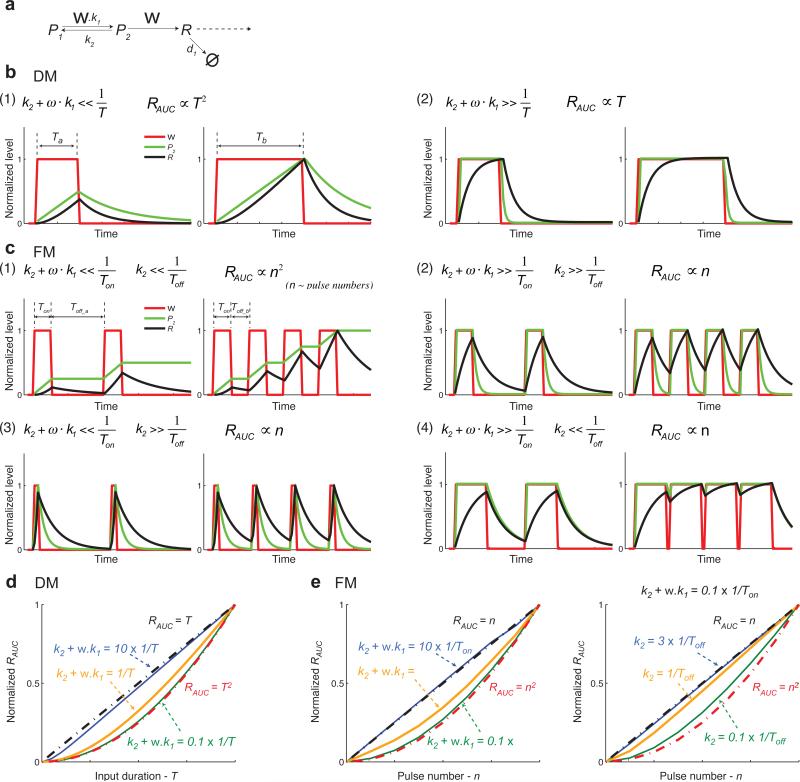
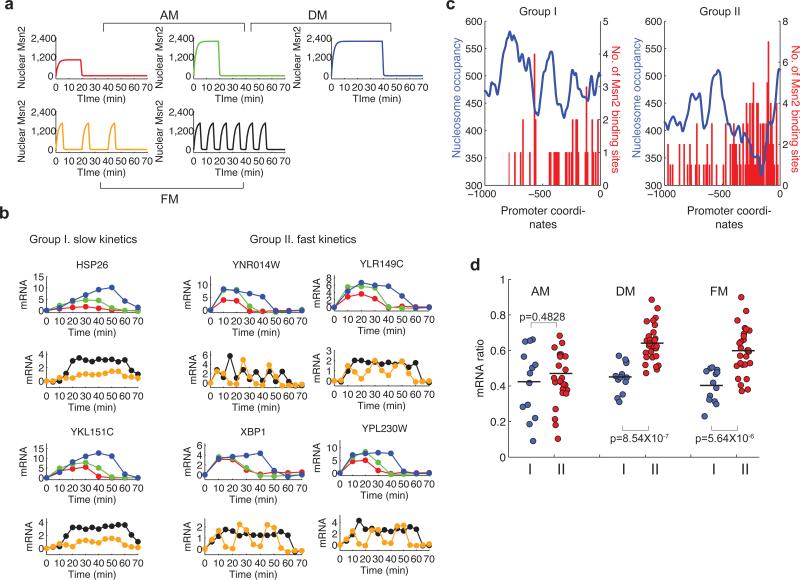
Information about environmental stimuli is often transmitted using common signaling molecules, but the mechanisms that ensure signaling specificity are not entirely known. Here we show that the identities and intensities of different stresses are transmitted by modulation of the amplitude, duration or frequency of nuclear translocation of the Saccharomyces cerevisiae general stress response transcription factor Msn2. Through artificial control of the dynamics of Msn2 translocation, we reveal how distinct dynamical schemes differentially affect reporter gene expression. Using a simple model, we predict stress-induced reporter gene expression from single-cell translocation dynamics. We then demonstrate that the response of natural target genes to dynamical modulation of Msn2 translocation is influenced by differences in the kinetics of promoter transitions and transcription factor binding properties. Thus, multiple environmental signals can trigger qualitatively different dynamics of a single transcription factor and influence gene expression patterns.


Figures

Fig. 1
Fig. 1
Msn2 translocates to the nucleus with different dynamics in response to different stresses. Time traces of Msn2-YFP nuclear translocation are shown for (a) glucose limitation, (b) osmotic stress and (c) oxidative stress. In each panel, top row: averages of single-cell time traces of Msn2-YFP translocation in response to the indicated stresses (solid circles: averages of single-cell experimental data; solid lines: standard deviation of single cell responses of ~ 60 cells, from at least two independent experiments); bottom row: representative single-cell time traces of Msn2-YFP nuclear translocation. AU: arbitrary units of fluorescence. Additional single-cell traces are shown in Supplementary Fig. 1a-b.
Fig. 2
Fig. 2
Quantification of single-cell Msn2-YFP translocation traces. (a) A schematic defines the initial peak of Msn2 nuclear translocation and subsequent sporadic bursts in a single-cell time trace. (b) Duration (top row) and amplitude (middle row) of the initial peak are quantified for the indicated stress conditions (open circles: mean value of single cells; error bars: standard deviation of single cell responses of ~60 cells, from at least two independent experiments). Duration is not quantified for the H2O2 treatment because a sustained translocation event was observed under this condition. (c), Frequency, amplitude, burst duration and interval durations of sporadic bursts in response to glucose limitation are quantified and shown as indicated. In addition, frequency of sporadic bursts under osmotic stress is quantified. The distributions of amplitude, duration, and frequency of sporadic nuclear burst in response to glucose limitation are shown in Supplementary Fig. 2a-c. Autocorrelation analysis of Msn2 localization traces upon glucose limitation has been performed and is presented in Supplementary Fig. 2d.
Fig. 3
Fig. 3
Experimental and computational analysis of gene expression in response to modulation of Msn2 nuclear translocation dynamics. (a) A diagram describes the analog-sensitive system used to control Msn2 nuclear translocation. (b) Gene expression model. A detailed description of the model construction and fitting procedure are included in Supplementary Results. (c) Averages of single-cell time traces of Msn2-YFP nuclear localization and reporter gene expression (CFP) measured in the same cells in response to inhibitor treatments (black solid circles: averages of time trace data; black solid lines: standard deviation of single-cell data of ~50 cells, from at least two independent experiments; green solid line: curve fitting of Msn2 translocation traces; red solid line: model simulation). The time traces of Msn2 nuclear localization were fit with a piecewise exponential function (Supplementary Fig. 3) to produce continuous time-dependent profiles, TF(t) , which served as input for the model. The model in b was fit to the averages of single-cell time traces of reporter gene expression (Supplementary Results). The complete dataset is included in Supplementary Fig. 3-5.
Fig. 4
Fig. 4
The dynamics of Msn2 nuclear translocation influences target gene expression. (a) The relationship between gene expression and the area under the curve (AUC) of Msn2 inputs (open circles: experimental data; solid lines: model simulation; error bars: standard deviation of single cell data of ~50 cells, from at least two independent experiments). The integrals of Msn2 inputs were quantified from the data in Supplementary Fig. 3-5. Single Msn2 inputs with 10 min (blue), 20 min (red), or 40 min (black) durations were compared with oscillatory Msn2 inputs with 5 min pulse duration (orange). (b) Relationship between dynamic of Msn2 nuclear inputs and reporter gene expression. Top left panel: gene expression vs Msn2 input amplitude (input duration: black - 40 min; red - 20 min; blue - 10 min); top right panel: gene expression vs Msn2 input duration (input amplitude: yellow green - 2,190 AU; orange - 1,751 AU; black - 1,309 AU; green - 1,010 AU; red - 672 AU; blue - 406 AU); bottom panel: gene expression vs Msn2 input frequency (input amplitude: 1,751 AU; pulse duration: 5 min). (c) Model simulations reproduce the measured expression responses to natural stresses. For the indicated stress conditions, each single-cell traces of Msn2 translocation was used as input for the gene expression model. The simulated single-cell expression traces were averaged to generate the simulation curves (solid lines, top row) and compared with averages of measured single-cell expression (solid circles, bottom row).
Fig. 5
Fig. 5
The model predicts that target genes have distinct responses to different input regimes. Two sets of parameters were varied and alterations in gene expression output were predicted using the expression model: parameters that govern transcription factor binding, Kd and n; and parameters that govern kinetics of promoter transition, k1 and k2. The inputs are selected to be in physiological ranges of the natural stress responses (Fig. 2) (a) The expression curves upon amplitude modulation (AM), duration modulation (DM) and frequency modulation (FM) (left column) and the expression ratios (the ratio of gene expression level upon low stimulus to expression level upon high stimulus) calculated from the expression curves (right column, same genes use same colors for curves and ratios) are shown for hypothetical genes with different binding parameters (Kd, n) and the same promoter kinetics (k1, k2). The values below the bar graph represent the fold changes from the parameter values obtained from fitting the reporter response data (Fig. 3). (b) Model predictions are shown for hypothetical genes with same binding parameters and different promoter kinetics. (c) Natural target genes may differ in both binding parameters and promoter kinetics. Model predictions for four hypothetical genes with different binding parameters and different promoter kinetics. Genes 1 and 2 have the same slow promoter kinetics while Genes 3 and 4 have the same fast promoter kinetics. Genes 1 and 3 have the same high transcription factor binding while Genes 2 and 4 have the same low transcription factor binding.
Fig. 6
Fig. 6
Analysis of a simplified model. (a) Schematic of the simplified model. (b) The model behaviors in response to duration modulation inputs. The input durations are Ta and Tb. Red lines: inputs (ω); Green lines: promoter activity (P2); Black lines: gene product (R). (c) The model behaviors in response to frequency modulation inputs. Pulse duration is Ton; the interval durations are Toff_a and Toff_b. Red lines: inputs (ω); Green lines: promoter activity (P2); Black lines: gene product (R). (d) The simulated relationship between gene expression output and input duration. Blue line: simulation with k2 +ω · k1 =10 ×1/T; orange line: simulation with k2 +ω · k1 =1/T; green line: simulation with k2 +ω · k1 = 0.1×1/T; these relationships are calculated with the median value of the input duration we used in the simulation. Black dashed lines: the curve of RAUC = T; red dashed lines: the curve of RAUC = T2. (e) The simulated relationship between gene expression output and oscillatory input pulse number (n). Black dashed lines: the curve of RAUC = n; red dashed lines: the curve of RAUC = n2. Left: we set k2 =ω · k1 and change k2 +ω · k1 to 10 × 1/Ton (blue line), 1/Ton (orange line), and 0.1 × 1/Ton (green line). With increasing frequency (pulse number), the interval duration changes from smaller than 1/Ton to larger than 1/Ton. Right: we set k2 +ω · k1 = 0.1×1/Ton and change Toff to 3 × 1/k2 (blue line), 1/k2 (orange line), and 0.1 × 1/k2 (green line). k2, ω, k1, and Ton are fixed. In this case, pulse number does not correlate with pulse frequency.
Fig. 7
Fig. 7
Microarray analysis to evaluate the model predictions. (a) Msn2 nuclear localization response to different 1-NM-PP1 treatments: red line - 120 nM 1-NM-PP1, 20 min; green line - 3 μM 1-NM-PP1, 20 min; blue line - 3 μM 1-NM-PP1, 40 min. orange line - 750 nM 1-NM-PP1, 5 min × 3; black line - 750 nM 1-NM-PP1, 5 min × 6. (b) Measured time courses of mRNA levels from representative target genes (solid circles: normalized fold change of mRNA level with baseline subtracted). The inputs in the panel a were used experimentally to produce the measured mRNA time traces (the input and the corresponding response use the same color). (c) Distributions of Msn2 binding sites (red) relative to the experimentally determined nucleosome profile (blue, unpublished data from the O'Shea lab) within promoters of target genes. The averaged nucleosome profiles were obtained by dividing the sum of nucleosome positioning signals of all genes in one group with the gene numbers. The distribution of Msn2 binding sites (AGGGG or CCCCT) is represented by bars corresponding to the sum of the numbers of Msn2 binding sites in each 10 bp window. (d) mRNA ratios of target genes in different encoding regimes (blue: Group I genes; red: Group II genes). The mRNA ratio of each gene is calculated from dividing the area under the curve of the mRNA time course (which correlates with gene expression level, Supplementary Fig. 7) at low transcription factor inputs by the area under the curve at high inputs.

References

    1. Shaywitz AJ, Greenberg ME. CREB: a stimulus-induced transcription factor activated by a diverse array of extracellular signals. Annu Rev Biochem. 1999;68:821–61. - PubMed
    1. Hao N, Zeng Y, Elston TC, Dohlman HG. Control of MAPK specificity by feedback phosphorylation of shared adaptor protein Ste50. J Biol Chem. 2008;283:33798–802. - PMC - PubMed
    1. Skalhegg BS, Tasken K. Specificity in the cAMP/PKA signaling pathway. Differential expression,regulation, and subcellular localization of subunits of PKA. Front Biosci. 2000;5:D678–93. - PubMed
    1. Behar M, Hoffmann A. Understanding the temporal codes of intra-cellular signals. Curr Opin Genet Dev. 2010;20:684–93. - PMC - PubMed
    1. Hoffmann A, Levchenko A, Scott ML, Baltimore D. The IkappaB-NF-kappaB signaling module: temporal control and selective gene activation. Science. 2002;298:1241–5. - PubMed

Publication types

MeSH terms

Associated data