. 2012 Feb;61(2):281-91.
doi: 10.2337/db11-0649. Epub 2011 Dec 16.

The L-α-lysophosphatidylinositol/GPR55 system and its potential role in human obesity

Affiliations

The L-α-lysophosphatidylinositol/GPR55 system and its potential role in human obesity

José María Moreno-Navarrete et al. Diabetes. 2012 Feb.

Abstract

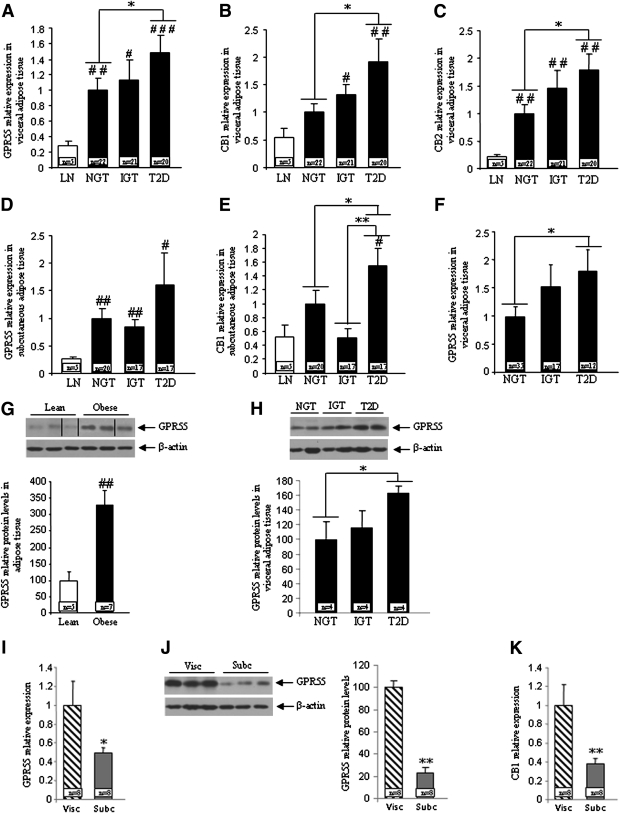
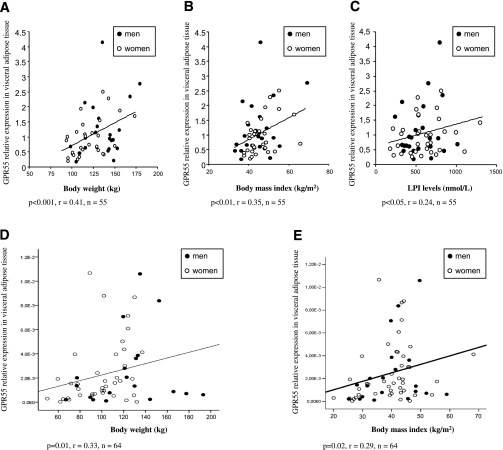
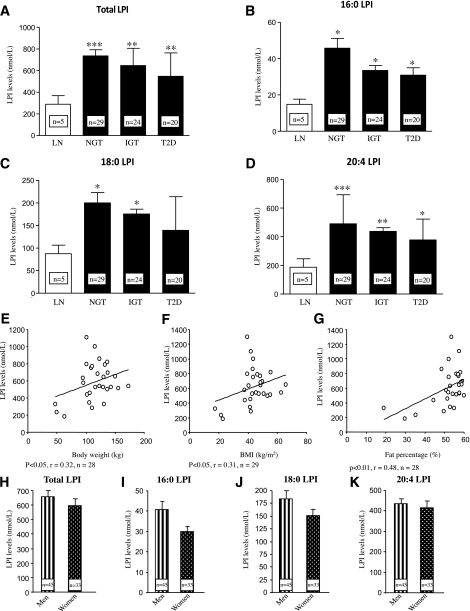
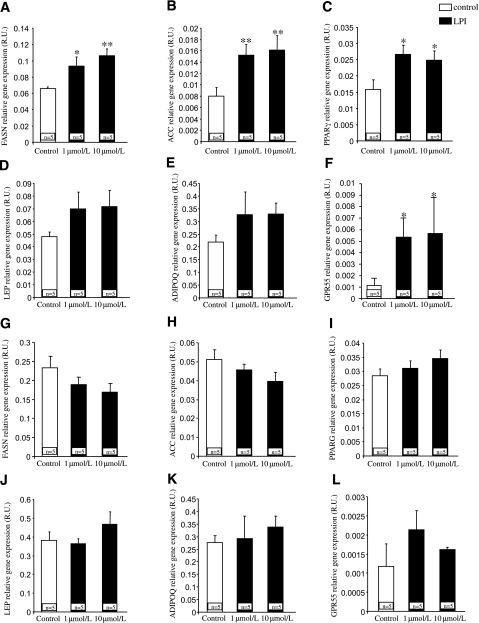
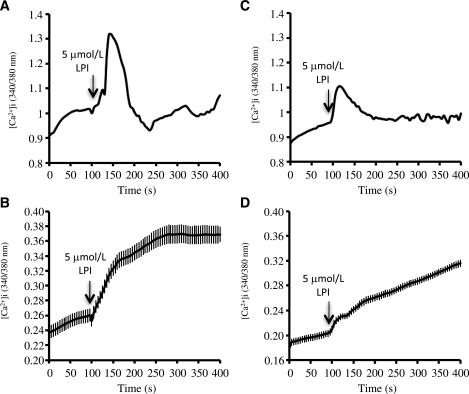
GPR55 is a putative cannabinoid receptor, and l-α-lysophosphatidylinositol (LPI) is its only known endogenous ligand. We investigated 1) whether GPR55 is expressed in fat and liver; 2) the correlation of both GPR55 and LPI with several metabolic parameters; and 3) the actions of LPI on human adipocytes. We analyzed CB1, CB2, and GPR55 gene expression and circulating LPI levels in two independent cohorts of obese and lean subjects, with both normal or impaired glucose tolerance and type 2 diabetes. Ex vivo experiments were used to measure intracellular calcium and lipid accumulation. GPR55 levels were augmented in the adipose tissue of obese subjects and further so in obese patients with type 2 diabetes when compared with nonobese subjects. Visceral adipose tissue GPR55 correlated positively with weight, BMI, and percent fat mass, particularly in women. Hepatic GPR55 gene expression was similar in obese and type 2 diabetic subjects. Circulating LPI levels were increased in obese patients and correlated with fat percentage and BMI in women. LPI increased the expression of lipogenic genes in visceral adipose tissue explants and intracellular calcium in differentiated visceral adipocytes. These findings indicate that the LPI/GPR55 system is positively associated with obesity in humans.


Figures

FIG. 1.
FIG. 1.
mRNA expression of GPR55 (A), CB1 (B), and CB2 (C) in VAT obtained from lean and obese subjects in cohort 1. mRNA expression of GPR55 (D) and CB1 (E) in SAT obtained from lean and obese subjects in cohort 1. mRNA expression of GPR55 (F) in VAT obtained from lean and obese subjects in cohort 2. Protein levels of GPR55 (G) in VAT obtained from lean and obese subjects in cohort 2. Dividing lines indicate splicings in the figure. Levels of GPR55 in the three different groups of obese patients (H). mRNA expression of GPR55 in the visceral and subcutaneous fat from the same obese patients (I). Protein levels of GPR55 in the visceral and subcutaneous fat from the same obese patients (J). mRNA expression of CB1 in the visceral and subcutaneous fat from the same obese patients (K). Obese subjects were subclassified as NGT, IGT, and type 2 diabetic. The relative amounts of mRNA were normalized to the value of NGT. T2D, type 2 diabetes; Visc, visceral; Subc, subcutaneous. #P < 0.05, ##P < 0.01, ###P < 0.001 vs. lean subjects; *P < 0.05, **P < 0.01 vs. NGT.
FIG. 2.
FIG. 2.
Correlation between VAT GPR55 and body weight (A), BMI (B), and circulating LPI (C) in individuals from cohort 1. For cohort 1, we performed the correlations using only obese individuals, and the cutoff value as a diagnosis of obesity was BMI >30 kg/m2. Correlation between VAT GPR55 and body weight (D) and BMI (E) in individuals from cohort 2.
FIG. 3.
FIG. 3.
Circulating levels of total LPI (A), 16:0 LPI (B), 18:0 LPI (C), and 20:4 LPI (D) in the plasma obtained from lean and obese subjects in cohort 1. Correlation between circulating levels (plasma obtained from a subset of individuals from cohort 1) of total LPI and body weight (E), BMI (F), and fat percentage (G) in women. Circulating levels of total LPI (H), 16:0 LPI (I), 18:0 LPI (J), and 20:4 LPI (K) in the plasma obtained from men and women in cohort 1. LN, lean; T2D, type 2 diabetes. *P < 0.05, **P < 0.01, ***P < 0.001.
FIG. 4.
FIG. 4.
Ex vivo effects of LPI (1 μmol/L and 10 μmol/L) on fatty acid synthase (FASN) (A), acetyl CoA carboxylase (ACC) (B), PPARγ (C), leptin (LEP) (D), adiponectin (ADIPOQ) (E), and GPR55 (F) in VAT explants. Ex vivo effects of LPI on FASN (G), ACC (H), PPARG (I), LEP (J), ADIPOQ (K), and GPR55 (L) in SAT explants. R.U., relative units. *P < 0.05, **P < 0.01.
FIG. 5.
FIG. 5.
Representative profiles of the effects of LPI (5 μmol/L) on [Ca2+]i in cultured differentiated human adipocytes obtained from visceral (A) and subcutaneous (C) fat. Arrows indicate the time of addition of LPI. A Fura-2 dual-wavelength fluorescence imaging system was used to measure [Ca2+]i as described in research design and methods. Quantitation of [Ca2+]i dynamics in differentiated adipocytes of VAT (B) and SAT (D) responsive to LPI (46 of 95 cells and 29 of 119 cells for VAT and SAT, respectively). Three independent experiments were conducted for both SAT and VAT adipocytes.

References

    1. Badman MK, Flier JS. The adipocyte as an active participant in energy balance and metabolism. Gastroenterology 2007;132:2103–2115 - PubMed
    1. Fernández-Real JM, Ricart W. Insulin resistance and chronic cardiovascular inflammatory syndrome. Endocr Rev 2003;24:278–301 - PubMed
    1. Matias I, Gonthier MP, Orlando P, et al. Regulation, function, and dysregulation of endocannabinoids in models of adipose and beta-pancreatic cells and in obesity and hyperglycemia. J Clin Endocrinol Metab 2006;91:3171–3180 - PubMed
    1. Pagotto U, Marsicano G, Cota D, Lutz B, Pasquali R. The emerging role of the endocannabinoid system in endocrine regulation and energy balance. Endocr Rev 2006;27:73–100 - PubMed
    1. Blüher M, Engeli S, Klöting N, et al. Dysregulation of the peripheral and adipose tissue endocannabinoid system in human abdominal obesity. Diabetes 2006;55:3053–3060 - PMC - PubMed

Publication types

MeSH terms