Temporal genome expression profile analysis during t-cell-mediated colitis: identification of novel targets and pathways
- PMID: 22179924
- PMCID: PMC4413946
- DOI: 10.1002/ibd.22842
Temporal genome expression profile analysis during t-cell-mediated colitis: identification of novel targets and pathways
Abstract
Background: T cells critically regulate inflammatory bowel disease (IBD), with T-cell-dependent experimental colitis models gaining favor in identifying potential pathogenic mechanisms; yet limited understanding of specific pathogenic molecules or pathways still exists.
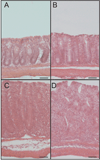
Methods: In this study we sought to identify changes in whole genome expression profiles using the CD4CD45Rbhi T-cell transfer colitis model compared to genome expression differences from Crohn's disease (CD) tissue specimens. Colon tissue was used for histopathological and genome expression profiling analysis at 0, 2, 4, or 6 weeks after adoptive T-cell transfer.
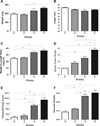
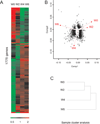
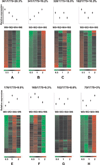
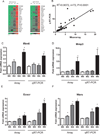
Results: We identified 1775 genes that were significantly altered during disease progression, with 361 being progressively downregulated and 341 progressively upregulated. Gene expression changes were validated by quantitative real-time polymerase chain reaction (qRT-PCR), confirming genome expression analysis data. Differentially expressed genes were clearly related to inflammation/immune responses but also strongly associated with metabolic, chemokine signaling, Jak-STAT signaling, and angiogenesis pathways. Ingenuity network analysis revealed 25 unique network associations that were associated with functions such as antigen presentation, cell morphology, cell-to-cell signaling and interaction, as well as nervous system development and function. Moreover, many of these genes and pathways were similarly identified in CD specimens.
Conclusions: These findings reveal novel, complex, and dynamic changes in gene expression that may provide useful targets for future therapeutic approaches.
Copyright © 2011 Crohn's & Colitis Foundation of America, Inc.
Conflict of interest statement
The authors have no conflict of interest to disclose.
Figures


Similar articles
-
Temporal genomewide expression profiling of DSS colitis reveals novel inflammatory and angiogenesis genes similar to ulcerative colitis.Physiol Genomics. 2011 Jan 7;43(1):43-56. doi: 10.1152/physiolgenomics.00138.2010. Epub 2010 Oct 5. Physiol Genomics. 2011. PMID: 20923862 Free PMC article.
-
High-resolution gene expression profiling using RNA sequencing in patients with inflammatory bowel disease and in mouse models of colitis.J Crohns Colitis. 2015 Jun;9(6):492-506. doi: 10.1093/ecco-jcc/jjv050. Epub 2015 Mar 20. J Crohns Colitis. 2015. PMID: 25795566
-
Genome-wide gene expression profiling of SCID mice with T-cell-mediated Colitis.Scand J Immunol. 2009 May;69(5):437-46. doi: 10.1111/j.1365-3083.2009.02243.x. Epub 2009 Feb 26. Scand J Immunol. 2009. PMID: 19508375
-
Divergent influence of microRNA-21 deletion on murine colitis phenotypes.Inflamm Bowel Dis. 2014 Nov;20(11):1972-85. doi: 10.1097/MIB.0000000000000201. Inflamm Bowel Dis. 2014. PMID: 25222661
-
T cell transfer model of chronic colitis: concepts, considerations, and tricks of the trade.Am J Physiol Gastrointest Liver Physiol. 2009 Feb;296(2):G135-46. doi: 10.1152/ajpgi.90462.2008. Epub 2008 Nov 25. Am J Physiol Gastrointest Liver Physiol. 2009. PMID: 19033538 Free PMC article. Review.
Cited by
-
Quality of methods reporting in animal models of colitis.Inflamm Bowel Dis. 2015 Jun;21(6):1248-59. doi: 10.1097/MIB.0000000000000369. Inflamm Bowel Dis. 2015. PMID: 25989337 Free PMC article.
-
Intestinal Inflammation Modulates the Expression of ACE2 and TMPRSS2 and Potentially Overlaps With the Pathogenesis of SARS-CoV-2-related Disease.Gastroenterology. 2021 Jan;160(1):287-301.e20. doi: 10.1053/j.gastro.2020.09.029. Epub 2020 Sep 25. Gastroenterology. 2021. PMID: 32980345 Free PMC article.
-
A Mucosal and Cutaneous Chemokine Ligand for the Lymphocyte Chemoattractant Receptor GPR15.Front Immunol. 2017 Sep 7;8:1111. doi: 10.3389/fimmu.2017.01111. eCollection 2017. Front Immunol. 2017. PMID: 28936214 Free PMC article.
-
Inflammation suppresses DLG2 expression decreasing inflammasome formation.J Cancer Res Clin Oncol. 2022 Sep;148(9):2295-2311. doi: 10.1007/s00432-022-04029-7. Epub 2022 May 2. J Cancer Res Clin Oncol. 2022. PMID: 35499706 Free PMC article. Clinical Trial.
-
Review and Meta-Analyses of TAAR1 Expression in the Immune System and Cancers.Front Pharmacol. 2018 Jun 26;9:683. doi: 10.3389/fphar.2018.00683. eCollection 2018. Front Pharmacol. 2018. PMID: 29997511 Free PMC article.
References
-
- Viennot S, Deleporte A, Moussata D, et al. Colon cancer in inflammatory bowel disease: recent trends, questions and answers. Gastroenterol Clin Biol. 2009;33(Suppl 3):S190–S201. - PubMed
-
- Benchimol EI, Fortinsky KJ, Gozdyra P, et al. Epidemiology of pediatric inflammatory bowel disease: a systematic review of international trends. Inflamm Bowel Dis. 17:423–439. - PubMed
-
- Okamoto S, Watanabe M, Yamazaki M, et al. A synthetic mimetic of CD4 is able to suppress disease in a rodent model of immune colitis. Eur J Immunol. 1999;29:355–366. - PubMed
Publication types
MeSH terms
Substances
Grants and funding
LinkOut - more resources
Full Text Sources
Medical
Molecular Biology Databases
