. 2012 Jun;67(6):1815-26.
doi: 10.1002/mrm.23189. Epub 2011 Dec 16.

Multivariate analysis of cartilage degradation using the support vector machine algorithm

Affiliations

Multivariate analysis of cartilage degradation using the support vector machine algorithm

Ping-Chang Lin et al. Magn Reson Med. 2012 Jun.

Abstract

An important limitation in MRI studies of early osteoarthritis is that measured MRI parameters exhibit substantial overlap between different degrees of cartilage degradation. We investigated whether multivariate support vector machine analysis would permit improved tissue characterization. Bovine nasal cartilage samples were subjected to pathomimetic degradation and their T(1), T(2), magnetization transfer rate (k(m) ), and apparent diffusion coefficient (ADC) were measured. Support vector machine analysis performed using certain parameter combinations exhibited particularly favorable classification properties. The areas under the receiver operating characteristic (ROC) curve for detection of extensive and mild degradation were 1.00 and 0.94, respectively, using the set (T(1), k(m), ADC), compared with 0.97 and 0.60 using T(1), the best univariate classifier. Furthermore, a degradation probability for each sample, derived from the support vector machine formalism using the parameter set (T(1), k(m), ADC), demonstrated much stronger correlations (r(2) = 0.79-0.88) with direct measurements of tissue biochemical components than did even the best-performing individual MRI parameter, T(1) (r(2) = 0.53-0.64). These results, combined with our previous investigation of Gaussian cluster-based tissue discrimination, indicate that the combinations (T(1), k(m)) and (T(1), k(m), ADC) may emerge as particularly useful for characterization of early cartilage degradation.


Figures

Figure 1
Figure 1
(A) Cross-sectional diagram of a single well of the 4-well sample holder for BNC samples. The samples were spaced to permit contact with bath fluid on all external surfaces. (B) A T1 image of BNC samples used for delineation of ROIs, as indicated, within the 4-well sample holder following 24-hr trypsin digestion.
Figure 2
Figure 2
Scatter plots of MRI measurements collected on pre- and post-24-hr enzymatically digested BNC samples. A single trial of the 10-fold cross-validation is shown, with the division of the full set of data points into a training set (empty symbols) and a validation set (filled symbols) for classification. Each validation set data point was classified into the pre-degraded class (◇ or ◆) or the post-degraded class (○ or ●) through the SVM model established using the training set. Results were obtained with a Gaussian kernel, K(X, X′)= e x−||pX−(X′||2/σ), with parameter values C = 16 and σ = 2 (see text) in (T1, km, ADC) space. The contour surface shown indicates the decision hypersurface on which the assignment probabilities to pre- and post-24-hr degraded classes are the same. Note that all data points from the pre-degraded group are located outside the bowl-shaped hypersurface, while all the post-degraded class points are inside the hypersurface; therefore, no classification errors occur for this particular trial.
Figure 3
Figure 3
ROC curves for evaluating the quality of classification of BNC samples into pre- and post-24-hr degradation groups, with the latter representing a high degree of degradation. Classification was based on the SVM algorithm for the multivariate MRI classifiers and on arithmetic means for the univariate MRI classifier. Each point on the ROC curves was calculated from the averaged classification results for the training sets (Panels A and B) or the validation sets (Panels C and D) in the 10-fold cross-validation. Panels B and D show enlargements of the regions between 0 – 0.4 on the abscissa and between 0.6 – 1 on the ordinate axes in Panels A and C, respectively. Twelve ROC curves corresponding to the eleven multivariate MRI classifiers and the best univariate T1 classifier are illustrated in each panel. The areas under the ROC curves for the validation sets are shown in Table 2.
Figure 4
Figure 4
ROC curves for evaluating the quality of classification of BNC samples into pre- and post- mild trypsin degradation groups, using data from Ref. (6). The procedures for classification and ROC curve construction were as described in Fig. 2, with areas under the ROC curves shown in Table 2 as well.
Figure 5
Figure 5
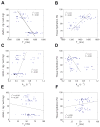
Relationships between the biochemical content of BNC and corresponding MRI parameters for control samples and samples following 24-hr trypsin degradation; n=36, with each sample evaluated before (open circles) and after (filled circles) degradation. Panels A – B: T1 vs. sGAG concentration per wet weight and tissue hydration. Panels C – D: km vs. sGAG concentration per wet weight and tissue hydration. Panels E – F: T2 vs. sGAG concentration per wet weight and tissue hydration.
Figure 6
Figure 6
Relationships between the biochemical content of pre- and post-24 hr trypsin-degraded BNC samples and their corresponding classification probabilities for the validation sets of the 10-fold cross-validation. Analysis was based on the two indicated MRI parameter combinations, (T1, km) and (T1, km, ADC), as described in the text. Each plot contains data from all 36 samples, before (open circles) and after degradation (filled circles). Panels A – B: sGAG concentration per wet weight and tissue hydration vs. assignment probability derived from the parameter set (T1, km). Panels C – D: sGAG concentration per wet weight and tissue hydration vs. assignment probability derived from the parameter set (T1, km, ADC).

Similar articles

Cited by

References

    1. Laurent D, Wasvary J, Rudin M, O’Byrne E, Pellas T. In vivo assessment of macromolecular content in articular cartilage of the goat knee. Magn Reson Med. 2003;49(6):1037–1046. - PubMed
    1. Lin P-C, Reiter DA, Spencer RG. Sensitivity and specificity of univariate MRI analysis of experimentally degraded cartilage. Magn Reson Med. 2009;62(5):1311–1318. - PMC - PubMed
    1. Chen CT, Fishbein KW, Torzilli PA, Hilger A, Spencer RG, Horton WE., Jr Matrix fixed-charge density as determined by magnetic resonance microscopy of bioreactor-derived hyaline cartilage correlates with biochemical and biomechanical properties. Arthritis Rheum. 2003;48(4):1047–1056. - PubMed
    1. Valerio M, Panebianco V, Sciarra A, Osimani M, Salsiccia S, Casciani L, Giuliani A, Bizzarri M, Di Silverio F, Passariello R, Conti F. Classification of prostatic diseases by means of multivariate analysis on in vivo proton MRSI and DCE-MRI data. NMR In Biomedicine. 2009;22(10):1036–1046. - PubMed
    1. Asllani I, Habeck C, Scarmeas N, Borogovac A, Brown TR, Stern Y. Multivariate and univariate analysis of continuous arterial spin labeling perfusion MRI in Alzheimer’s disease. Journal Of Cerebral Blood Flow And Metabolism. 2008;28(4):725–736. - PMC - PubMed

Publication types