

Dynamic contrast-enhanced magnetic resonance imaging as a prognostic factor in predicting event-free and overall survival in pediatric patients with osteosarcoma
- PMID: 22180392
- PMCID: PMC3310962
- DOI: 10.1002/cncr.26701
Dynamic contrast-enhanced magnetic resonance imaging as a prognostic factor in predicting event-free and overall survival in pediatric patients with osteosarcoma
Abstract
Background: The objective of this study was to prospectively evaluate dynamic contrast-enhanced magnetic resonance imaging (DCE-MRI) as an early imaging indicator of tumor histologic response to preoperative chemotherapy and as a possible prognostic factor for event-free survival (EFS) and overall survival in pediatric patients with newly diagnosed, nonmetastatic osteosarcoma who were treated on a single, multi-institutional phase 2 trial.
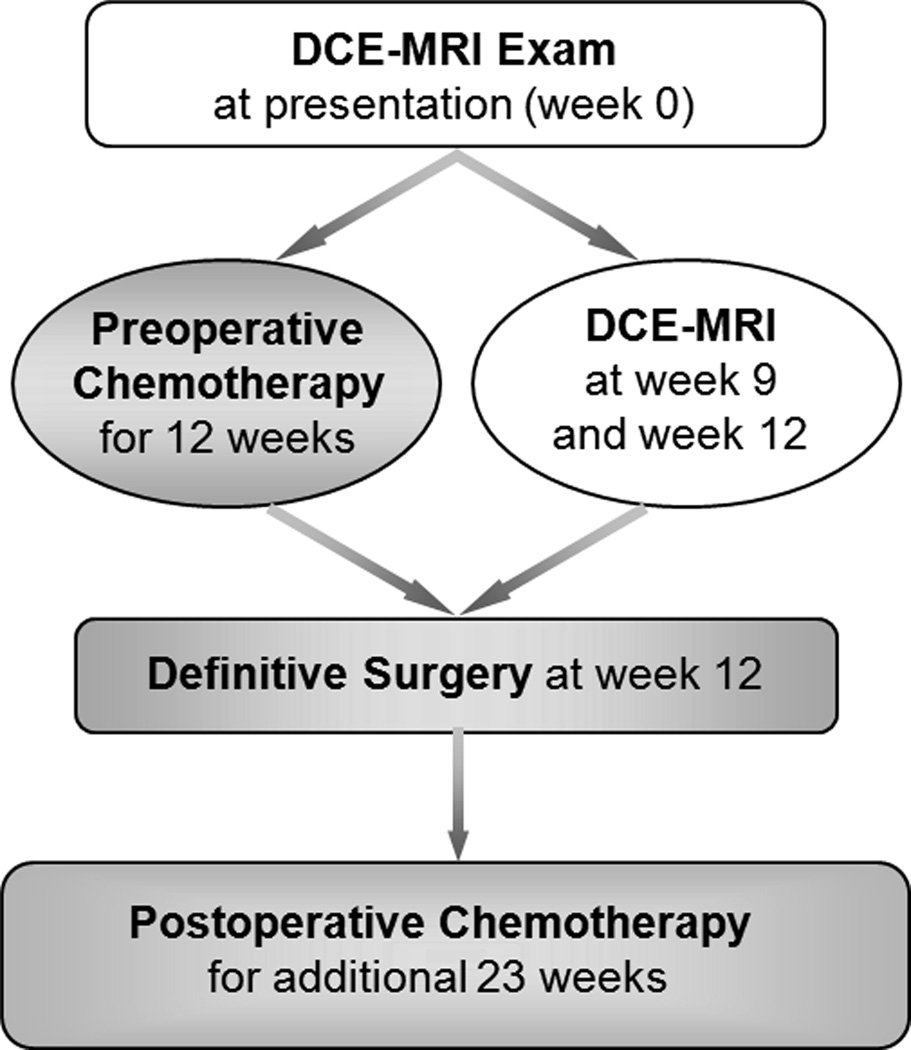
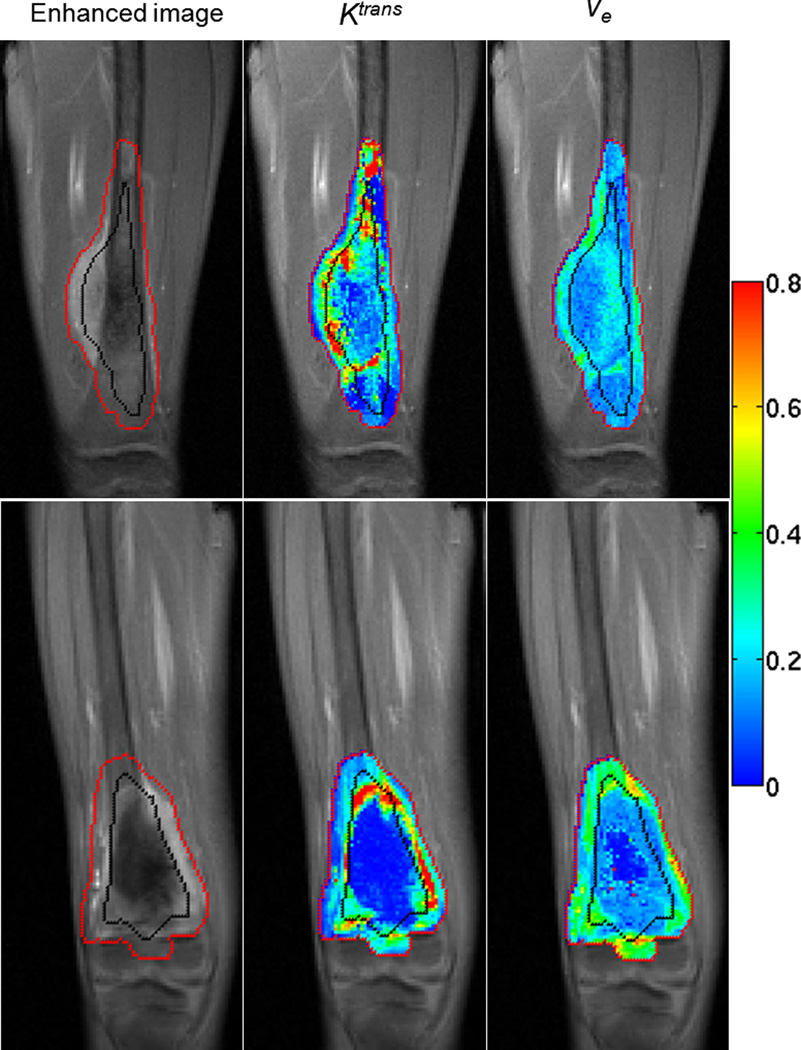
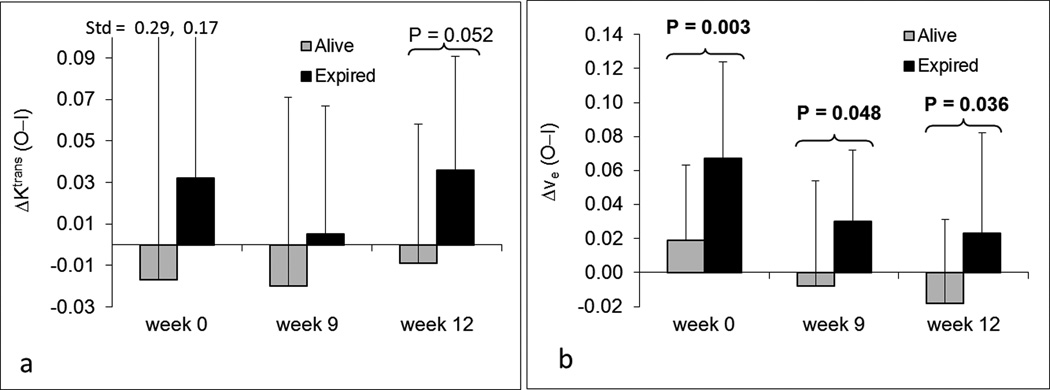
Methods: Three serial DCE-MRI examinations at week 0 (before treatment), week 9, and week 12 (tumor resection) were performed in 69 patients with nonmetastatic osteosarcoma to monitor the response to preoperative chemotherapy. Four DCE-MRI kinetic parameters (the influx volume transfer constant [K(trans) ], the efflux rate constant [k(ep) ], the relative extravascular extracellular space [v(e) ], and the relative vascular plasma space [v(p) ]) and the corresponding differences (ΔK(trans) , Δk(ep) , Δv(e) , and Δv(p) ) of averaged kinetic parameters between the outer and inner halves of tumors were calculated to assess their associations with tumor histologic response, EFS, and overall survival.
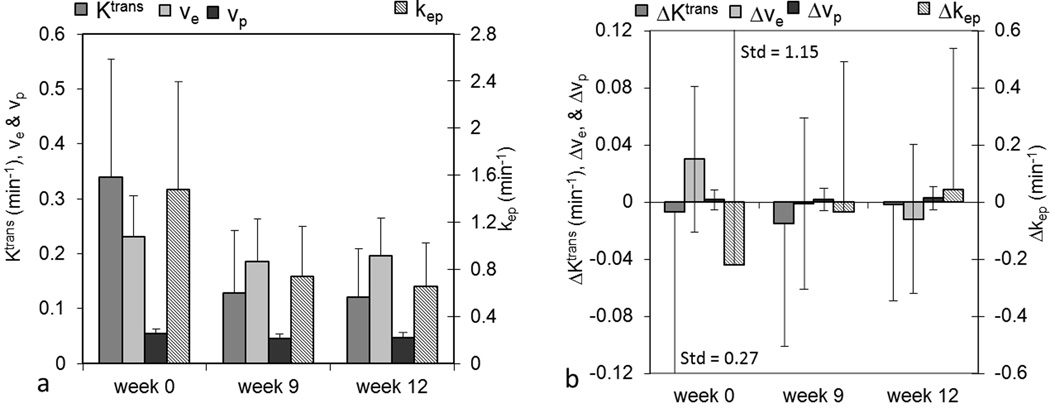
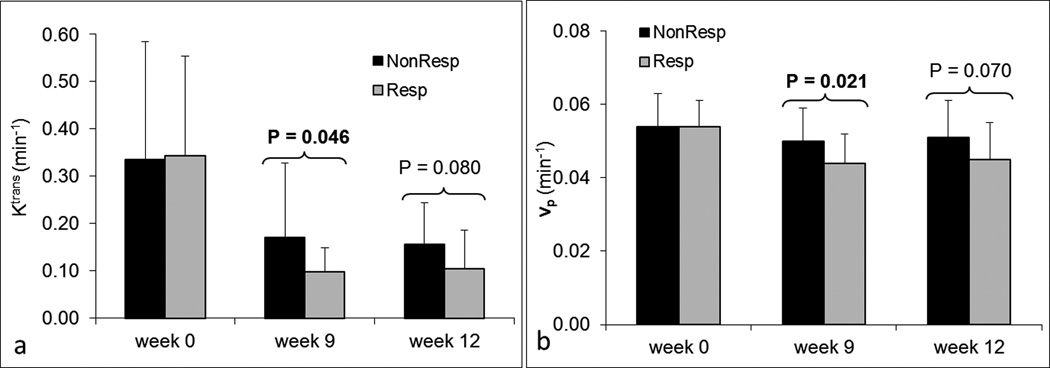
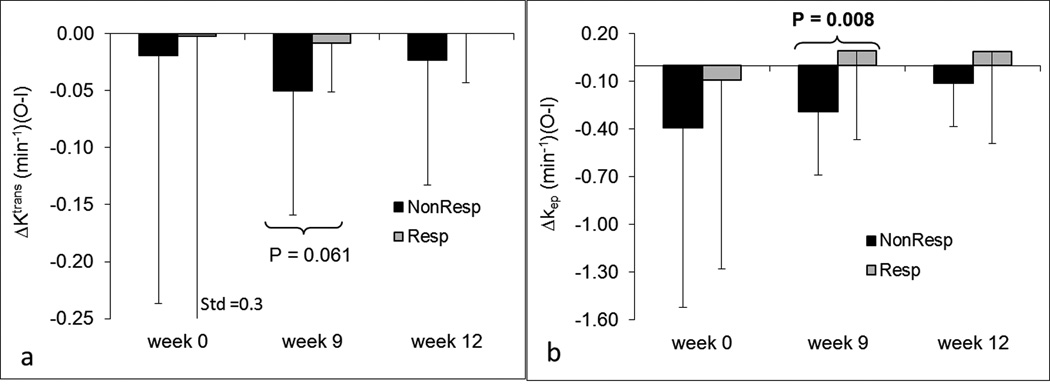
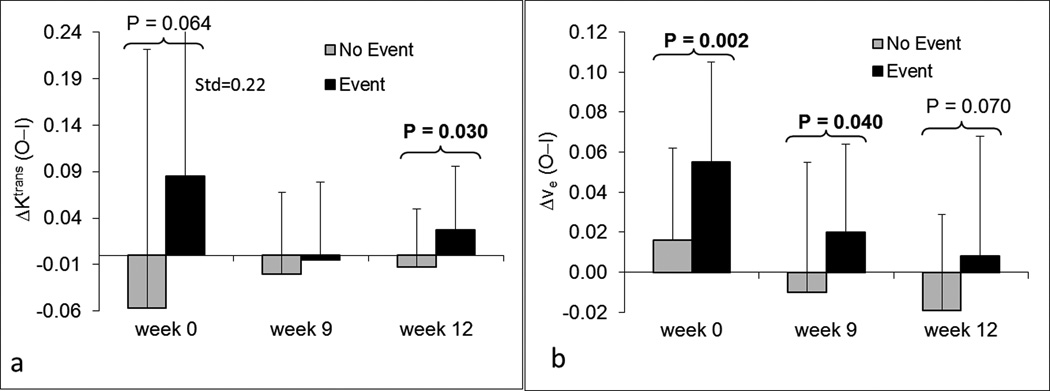
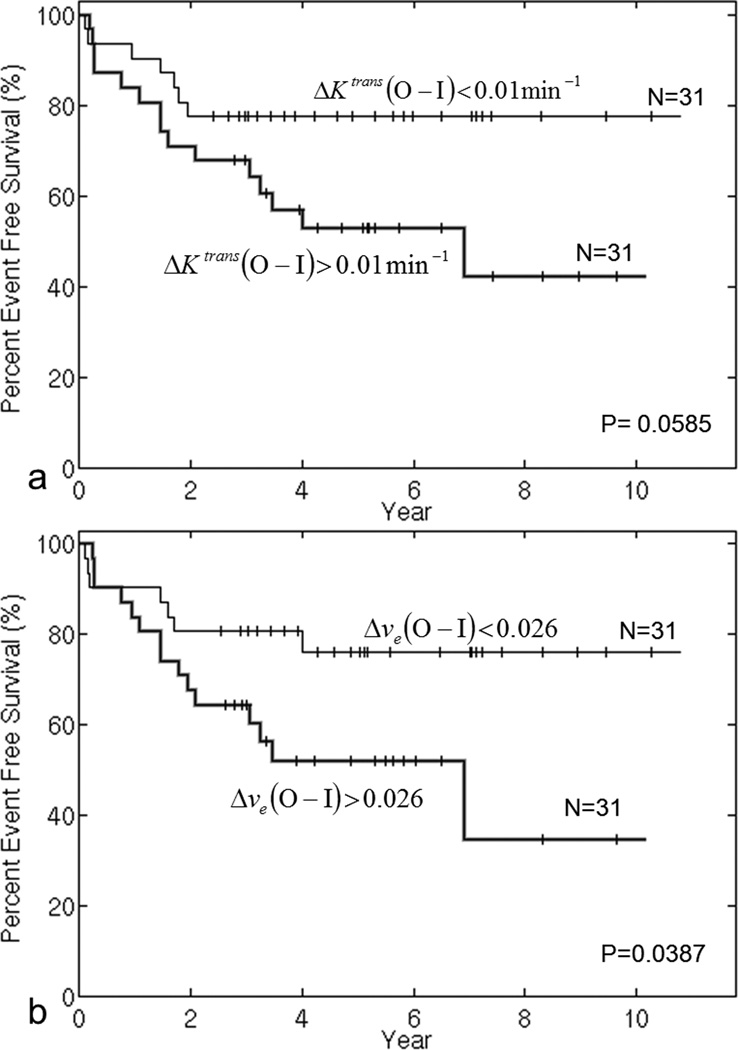
Results: The parameters K(trans) , v(e) , v(p) , and k(ep) decreased significantly from week 0 to week 9 and week 12. The parameters K(trans) , v(p) , and Δk(ep) at week 9 were significantly different between responders and nonresponders (P = .046, P = .021, and P = .008, respectively). These 3 parameters were indicative of histologic response. The parameter Δv(e) at week 0 was a significant prognostic factor for both EFS (P = .02) and overall survival (P = .03).
Conclusions: DCE-MRI was identified as a prognostic factor for EFS and overall survival before treatment on this trial and was indicative of a histologic response to neoadjuvant therapy. Further studies are needed to verify these findings with other treatment regimens and establish the potential role of DCE-MRI in the development of risk-adapted therapy for osteosarcoma.
Copyright © 2011 American Cancer Society.
Figures
References
-
- Malawer MM, Link MP, Donaldson SS, DeVita DT, Jr, Rosenberg SA, Hellman S. Cancer: principles and practice of oncology. Philadelphia, PA: Lippincott Williams and Wilkins; 2001. Sarcomas of bone; pp. 1891–1935.
-
- Bacci G, Ferrari S, Longhi A, et al. Pattern of relapse in patients with osteosarcoma of the extremities treated with neoadjuvant chemotherapy. Eur.J.Cancer. 2001;37(1):32–38. - PubMed
-
- Huvos AG, Rosen G, Marcove RC. Primary osteogenic sarcoma: pathologic aspects in 20 patients after treatment with chemotherapy, en bloc resection, and prosthetic bone replacement. Arch.Pathol.Lab.Med. 1977;101:14–18. - PubMed
-
- Raymond AK, Chawla SP, Carrasco CH, et al. Osteosarcoma chemotherapy effect: a prognostic factor. Semin.Diagn.Pathol. 1987;4:212–236. - PubMed
-
- Rosen G, Caparros B, Huvos AG, et al. Preoperative chemotherapy for osteogenic sarcoma: selection of postoperative adjuvant chemotherapy based on the response of the primary tumor to preoperative chemotherapy. Cancer. 1982;49:1221–1230. - PubMed
Publication types
MeSH terms
Substances
Grants and funding
LinkOut - more resources
Full Text Sources
Medical
