

E2F7 represses a network of oscillating cell cycle genes to control S-phase progression
- PMID: 22180533
- PMCID: PMC3333892
- DOI: 10.1093/nar/gkr1203
E2F7 represses a network of oscillating cell cycle genes to control S-phase progression
Abstract
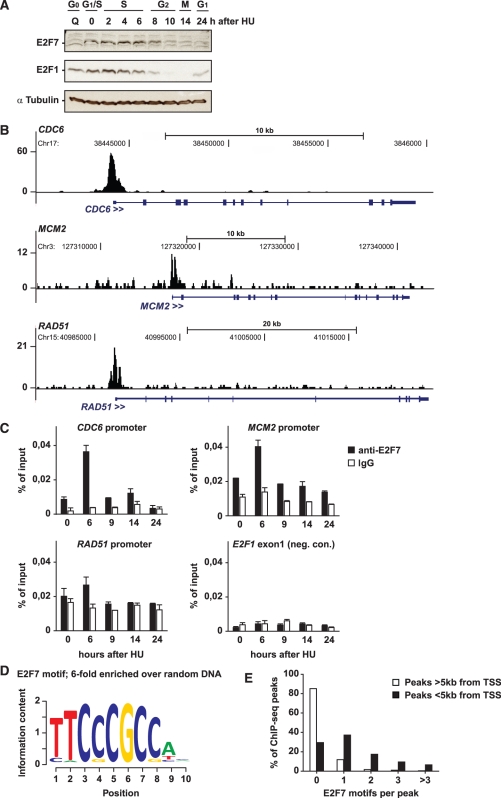
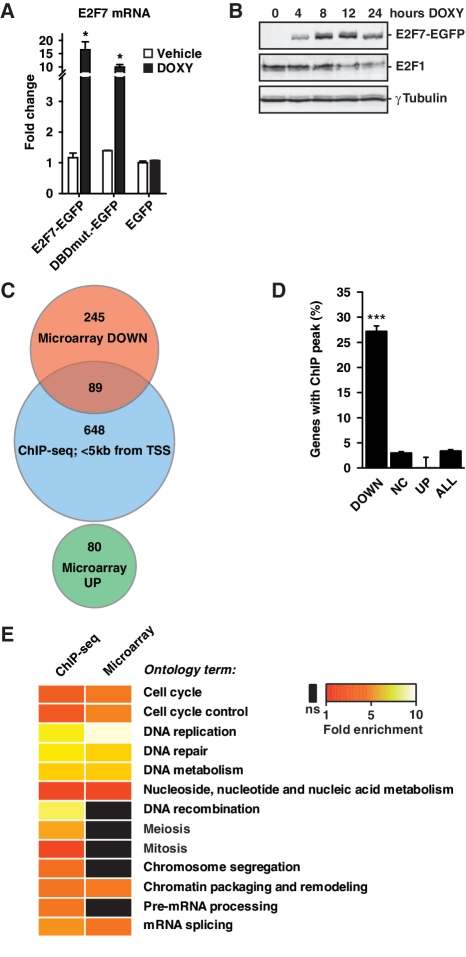
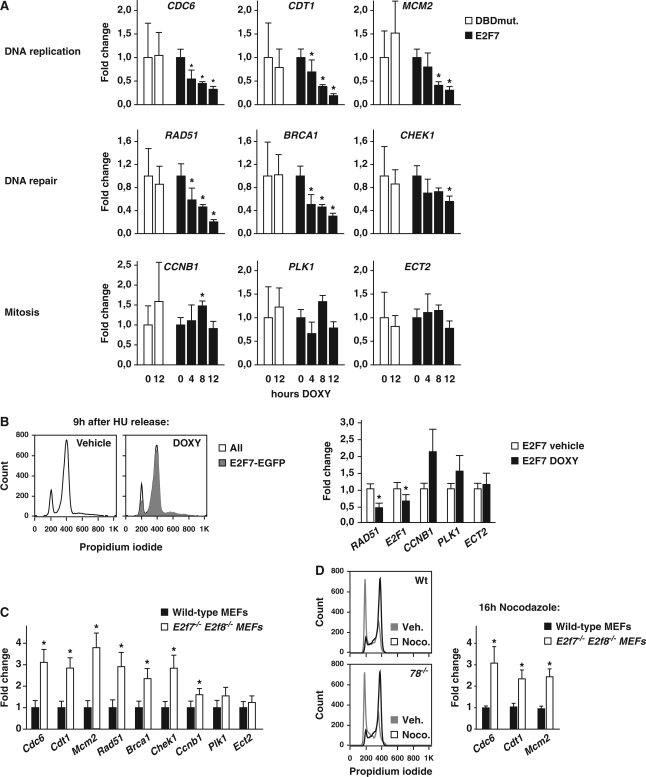
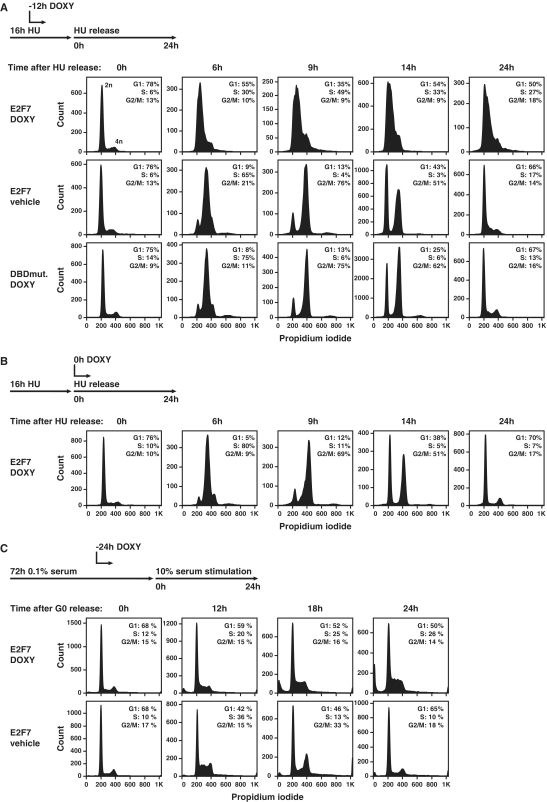
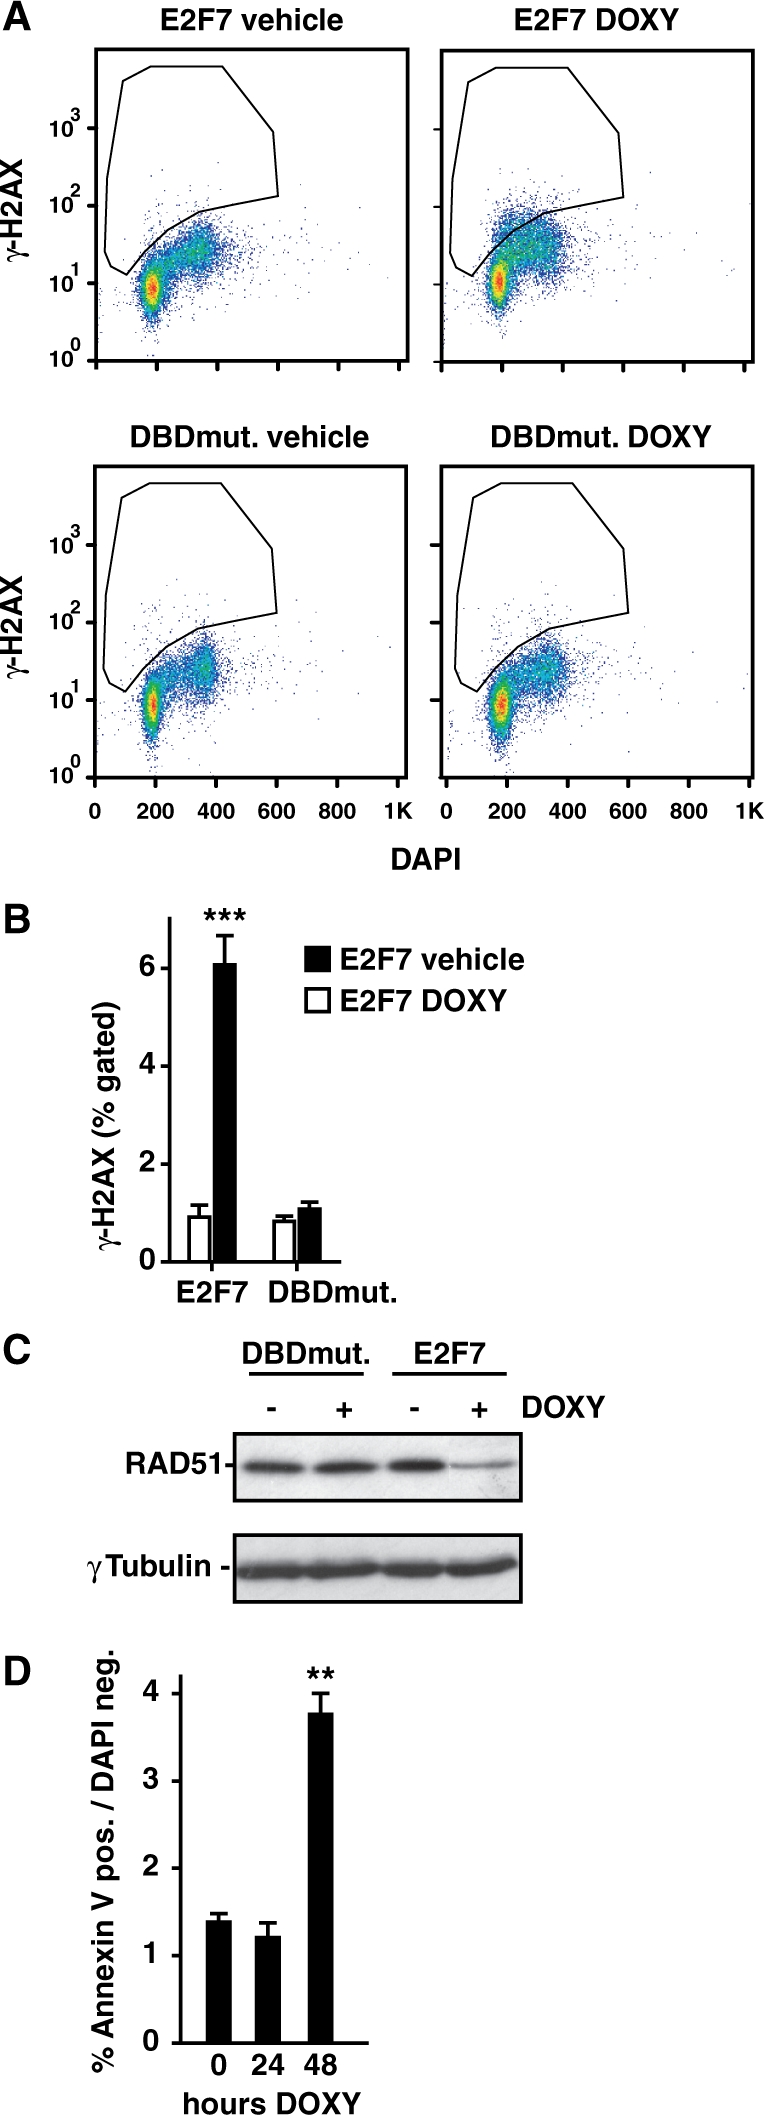
E2F transcription factors are known to be important for timely activation of G(1)/S and G(2)/M genes required for cell cycle progression, but transcriptional mechanisms for deactivation of cell cycle-regulated genes are unknown. Here, we show that E2F7 is highly expressed during mid to late S-phase, occupies promoters of G(1)/S-regulated genes and represses their transcription. ChIP-seq analysis revealed that E2F7 binds preferentially to genomic sites containing the TTCCCGCC motif, which closely resembles the E2F consensus site. We identified 89 target genes that carry E2F7 binding sites close to the transcriptional start site and that are directly repressed by short-term induction of E2F7. Most of these target genes are known to be activated by E2Fs and are involved in DNA replication, metabolism and DNA repair. Importantly, induction of E2F7 during G(0)-G(1)/S resulted in S-phase arrest and DNA damage, whereas expression of E2F7 during G(2)/M failed to disturb cell cycle progression. These findings provide strong evidence that E2F7 directly controls the downswing of oscillating G(1)/S genes during S-phase progression.
Figures
Similar articles
-
Cyclin F-dependent degradation of E2F7 is critical for DNA repair and G2-phase progression.EMBO J. 2019 Oct 15;38(20):e101430. doi: 10.15252/embj.2018101430. Epub 2019 Sep 2. EMBO J. 2019. PMID: 31475738 Free PMC article.
-
E2F7, a novel E2F featuring DP-independent repression of a subset of E2F-regulated genes.EMBO J. 2003 Dec 1;22(23):6289-98. doi: 10.1093/emboj/cdg613. EMBO J. 2003. PMID: 14633988 Free PMC article.
-
Characterization of E2F8, a novel E2F-like cell-cycle regulated repressor of E2F-activated transcription.Nucleic Acids Res. 2005 Sep 22;33(17):5458-70. doi: 10.1093/nar/gki855. Print 2005. Nucleic Acids Res. 2005. PMID: 16179649 Free PMC article.
-
Cell cycle arrest through indirect transcriptional repression by p53: I have a DREAM.Cell Death Differ. 2018 Jan;25(1):114-132. doi: 10.1038/cdd.2017.172. Epub 2017 Nov 10. Cell Death Differ. 2018. PMID: 29125603 Free PMC article. Review.
-
Transcription factors and the down-regulation of G1/S boundary genes in human diploid fibroblasts during senescence.Front Biosci. 1997 Sep 1;2:d417-26. doi: 10.2741/a201. Front Biosci. 1997. PMID: 9281303 Review.
Cited by
-
The non-genotoxic activator of the p53 pathway Nutlin-3 shifts the balance between E2F7 and E2F1 transcription factors in leukemic cells.Invest New Drugs. 2013 Apr;31(2):458-60. doi: 10.1007/s10637-012-9882-y. Epub 2012 Oct 2. Invest New Drugs. 2013. PMID: 23054209
-
E2F2 and CREB cooperatively regulate transcriptional activity of cell cycle genes.Nucleic Acids Res. 2013 Dec;41(22):10185-98. doi: 10.1093/nar/gkt821. Epub 2013 Sep 12. Nucleic Acids Res. 2013. PMID: 24038359 Free PMC article.
-
Atypical E2fs control lymphangiogenesis through transcriptional regulation of Ccbe1 and Flt4.PLoS One. 2013 Sep 12;8(9):e73693. doi: 10.1371/journal.pone.0073693. eCollection 2013. PLoS One. 2013. PMID: 24069224 Free PMC article.
-
Circ-AASDH functions as the progression of early stage lung adenocarcinoma by targeting miR-140-3p to activate E2F7 expression.Transl Lung Cancer Res. 2021 Jan;10(1):57-70. doi: 10.21037/tlcr-20-1062. Transl Lung Cancer Res. 2021. PMID: 33569293 Free PMC article.
-
Engineered model of heart tissue repair for exploring fibrotic processes and therapeutic interventions.Nat Commun. 2024 Sep 12;15(1):7996. doi: 10.1038/s41467-024-52221-9. Nat Commun. 2024. PMID: 39266508 Free PMC article.
References
-
- Reichel R, Kovesdi I, Nevins JR. Developmental control of a promoter-specific factor that is also regulated by the E1A gene product. Cell. 1987;48:501–506. - PubMed
-
- Van Den Heuvel S, Dyson NJ. Conserved functions of the pRB and E2F families. Nat. Rev. Mol. Cell Biol. 2008;9:713–724. - PubMed
-
- Dimova DK, Dyson NJ. The E2F transcriptional network: old acquaintances with new faces. Oncogene. 2005;24:2810–2826. - PubMed
Publication types
MeSH terms
Substances
LinkOut - more resources
Full Text Sources
Other Literature Sources
Molecular Biology Databases
