

GLYCOALKALOID METABOLISM1 is required for steroidal alkaloid glycosylation and prevention of phytotoxicity in tomato
- PMID: 22180624
- PMCID: PMC3269880
- DOI: 10.1105/tpc.111.088732
GLYCOALKALOID METABOLISM1 is required for steroidal alkaloid glycosylation and prevention of phytotoxicity in tomato
Abstract
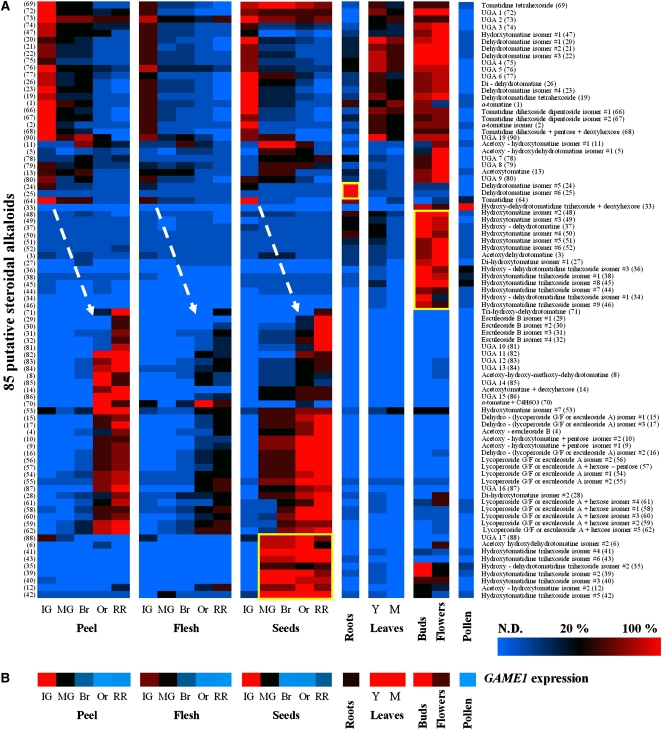
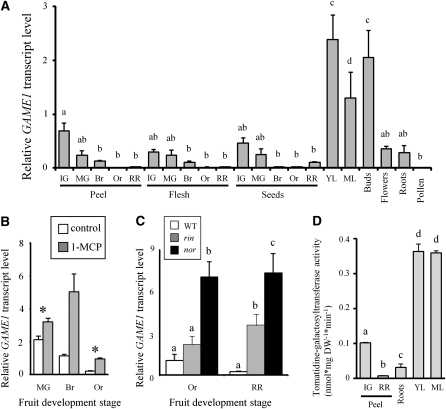
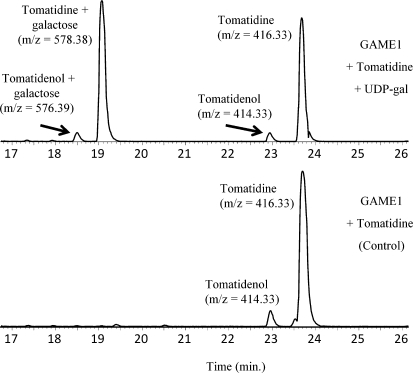
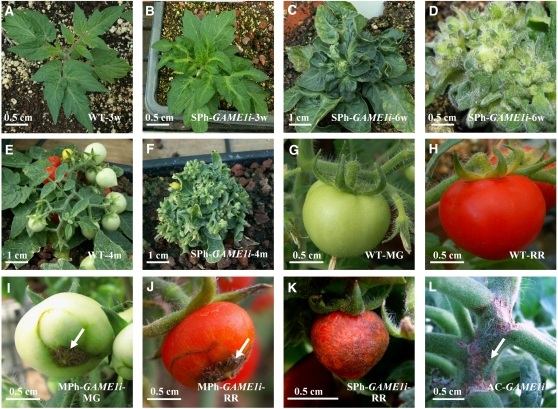
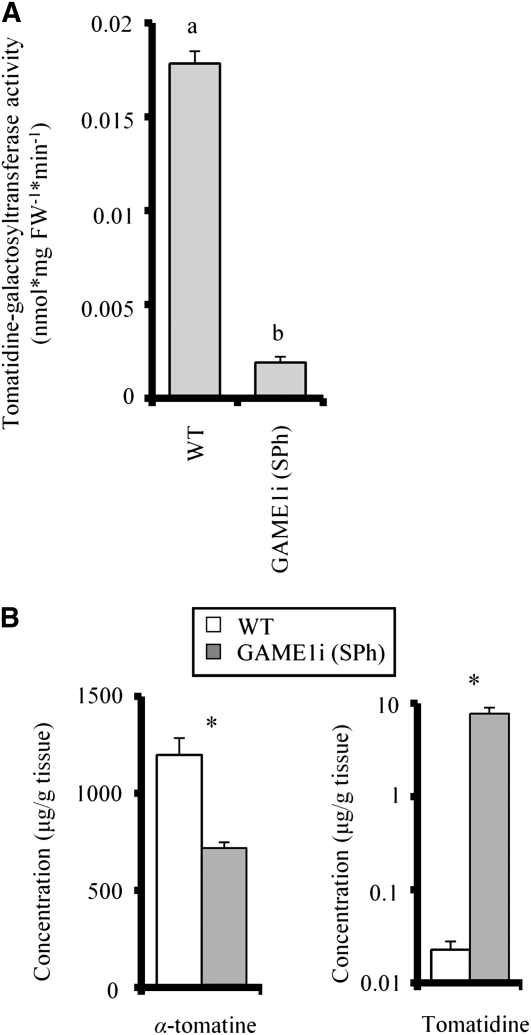
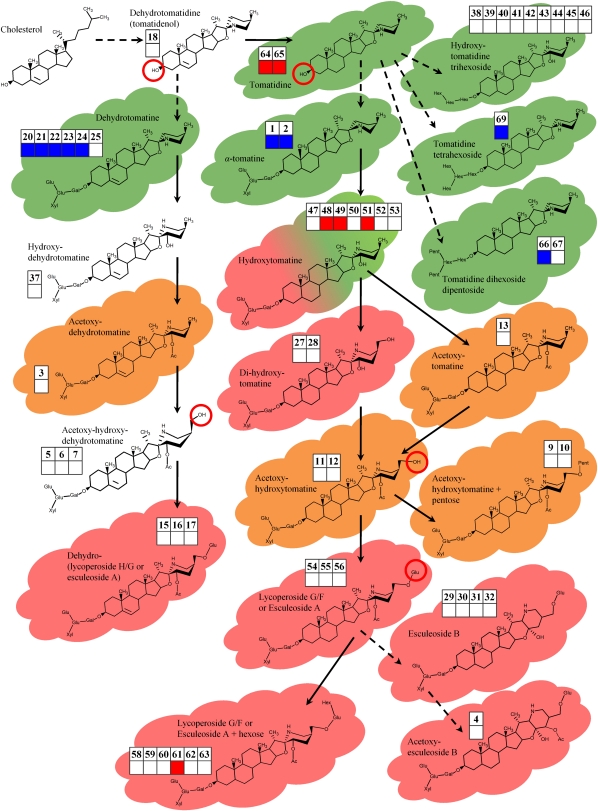
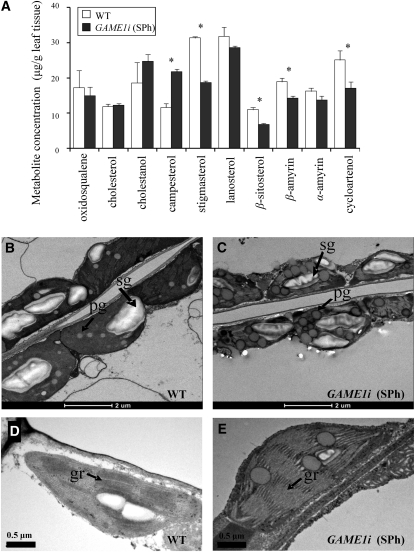
Steroidal alkaloids (SAs) are triterpene-derived specialized metabolites found in members of the Solanaceae family that provide plants with a chemical barrier against a broad range of pathogens. Their biosynthesis involves the action of glycosyltransferases to form steroidal glycoalkaloids (SGAs). To elucidate the metabolism of SGAs in the Solanaceae family, we examined the tomato (Solanum lycopersicum) GLYCOALKALOID METABOLISM1 (GAME1) gene. Our findings imply that GAME1 is a galactosyltransferase, largely performing glycosylation of the aglycone tomatidine, resulting in SGA production in green tissues. Downregulation of GAME1 resulted in an almost 50% reduction in α-tomatine levels (the major SGA in tomato) and a large increase in its precursors (i.e., tomatidenol and tomatidine). Surprisingly, GAME1-silenced plants displayed growth retardation and severe morphological phenotypes that we suggest occur as a result of altered membrane sterol levels caused by the accumulation of the aglycone tomatidine. Together, these findings highlight the role of GAME1 in the glycosylation of SAs and in reducing the toxicity of SA metabolites to the plant cell.
Figures
Similar articles
-
Short-chain dehydrogenase/reductase governs steroidal specialized metabolites structural diversity and toxicity in the genus Solanum.Proc Natl Acad Sci U S A. 2018 Jun 5;115(23):E5419-E5428. doi: 10.1073/pnas.1804835115. Epub 2018 May 21. Proc Natl Acad Sci U S A. 2018. PMID: 29784829 Free PMC article.
-
Identification of a 3β-Hydroxysteroid Dehydrogenase/ 3-Ketosteroid Reductase Involved in α-Tomatine Biosynthesis in Tomato.Plant Cell Physiol. 2019 Jun 1;60(6):1304-1315. doi: 10.1093/pcp/pcz049. Plant Cell Physiol. 2019. PMID: 30892648
-
Tomato E8 Encodes a C-27 Hydroxylase in Metabolic Detoxification of α-Tomatine during Fruit Ripening.Plant Cell Physiol. 2021 Oct 1;62(5):775-783. doi: 10.1093/pcp/pcab080. Plant Cell Physiol. 2021. PMID: 34100555
-
The steroidal alkaloids α-tomatine and tomatidine: Panorama of their mode of action and pharmacological properties.Steroids. 2021 Dec;176:108933. doi: 10.1016/j.steroids.2021.108933. Epub 2021 Oct 23. Steroids. 2021. PMID: 34695457 Review.
-
The bitter side of the nightshades: Genomics drives discovery in Solanaceae steroidal alkaloid metabolism.Phytochemistry. 2015 May;113:24-32. doi: 10.1016/j.phytochem.2014.12.010. Epub 2014 Dec 31. Phytochemistry. 2015. PMID: 25556315 Review.
Cited by
-
Identification and mode of inheritance of quantitative trait loci for secondary metabolite abundance in tomato.Plant Cell. 2015 Mar;27(3):485-512. doi: 10.1105/tpc.114.132266. Epub 2015 Mar 13. Plant Cell. 2015. PMID: 25770107 Free PMC article.
-
Co-mapping studies of QTLs for fruit acidity and candidate genes of organic acid metabolism and proton transport in sweet melon (Cucumis melo L.).Theor Appl Genet. 2012 Jul;125(2):343-53. doi: 10.1007/s00122-012-1837-3. Epub 2012 Mar 10. Theor Appl Genet. 2012. PMID: 22406955
-
Integrated Metabolomics and Transcriptomics Analyses Reveal the Metabolic Differences and Molecular Basis of Nutritional Quality in Landraces and Cultivated Rice.Metabolites. 2022 Apr 22;12(5):384. doi: 10.3390/metabo12050384. Metabolites. 2022. PMID: 35629888 Free PMC article.
-
Plant terpenoid metabolism co-opts a component of the cell wall biosynthesis machinery.Nat Chem Biol. 2020 Jul;16(7):740-748. doi: 10.1038/s41589-020-0541-x. Epub 2020 May 18. Nat Chem Biol. 2020. PMID: 32424305
-
Characterization of steroid 5α-reductase involved in α-tomatine biosynthesis in tomatoes.Plant Biotechnol (Tokyo). 2019 Dec 25;36(4):253-263. doi: 10.5511/plantbiotechnology.19.1030a. Plant Biotechnol (Tokyo). 2019. PMID: 31983879 Free PMC article.
References
-
- Arie T., Takahashi H., Kodama M., Teraoka T. (2007). Tomato as a model plant for plant-pathogen interactions. Plant Biotech. 24: 135–147
-
- Astua-Monge G., Minsavage G.V., Stall R.E., Davis M.J., Bonas U., Jones J.B. (2000). Resistance of tomato and pepper to T3 strains of Xanthomonas campestris pv. vesicatoria is specified by a plant-inducible avirulence gene. Mol. Plant Microbe Interact. 13: 911–921 - PubMed
-
- Babiychuk E., Bouvier-Navé P., Compagnon V., Suzuki M., Muranaka T., Van Montagu M., Kushnir S., Schaller H. (2008). Allelic mutant series reveal distinct functions for Arabidopsis cycloartenol synthase 1 in cell viability and plastid biogenesis. Proc. Natl. Acad. Sci. USA 105: 3163–3168 - PMC - PubMed
Publication types
MeSH terms
Substances
Associated data
- Actions
- Actions
- Actions
LinkOut - more resources
Full Text Sources
Other Literature Sources
Molecular Biology Databases
