. 2011 Dec;5(12):e1381.
doi: 10.1371/journal.pntd.0001381. Epub 2011 Dec 13.

Epidemiological tracking and population assignment of the non-clonal bacterium, Burkholderia pseudomallei

Affiliations

Epidemiological tracking and population assignment of the non-clonal bacterium, Burkholderia pseudomallei

Julia Dale et al. PLoS Negl Trop Dis. 2011 Dec.

Abstract

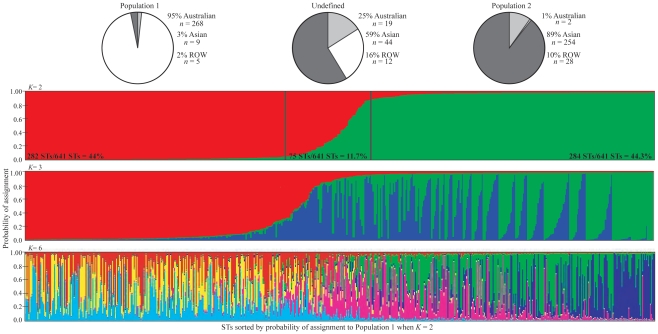
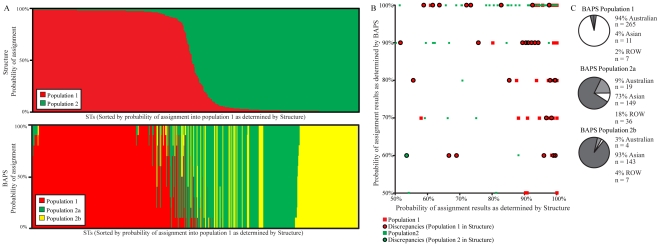
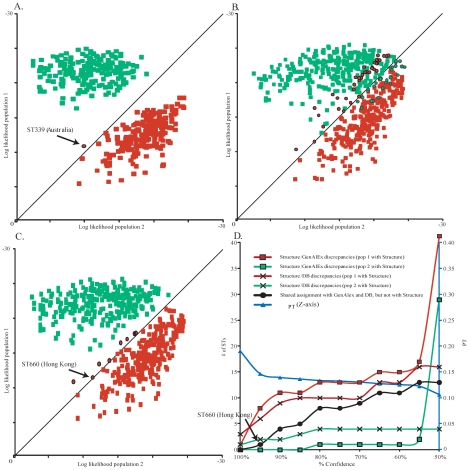
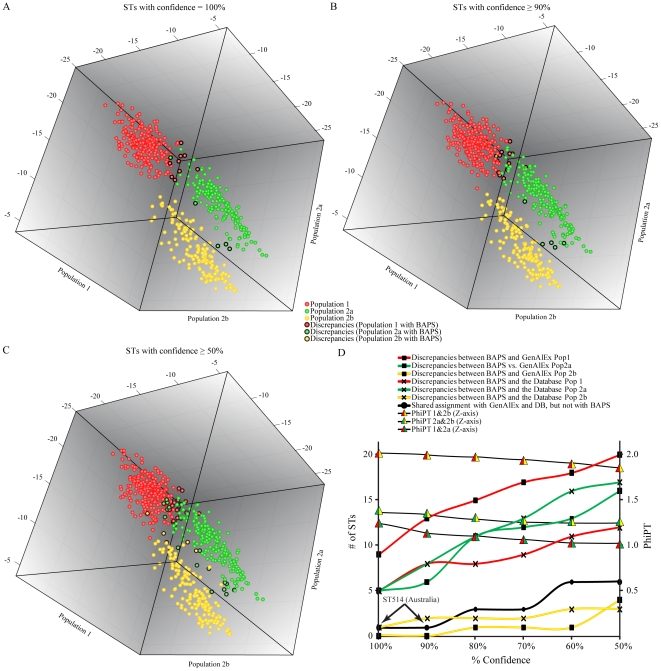
Rapid assignment of bacterial pathogens into predefined populations is an important first step for epidemiological tracking. For clonal species, a single allele can theoretically define a population. For non-clonal species such as Burkholderia pseudomallei, however, shared allelic states between distantly related isolates make it more difficult to identify population defining characteristics. Two distinct B. pseudomallei populations have been previously identified using multilocus sequence typing (MLST). These populations correlate with the major foci of endemicity (Australia and Southeast Asia). Here, we use multiple Bayesian approaches to evaluate the compositional robustness of these populations, and provide assignment results for MLST sequence types (STs). Our goal was to provide a reference for assigning STs to an established population without the need for further computational analyses. We also provide allele frequency results for each population to enable estimation of population assignment even when novel STs are discovered. The ability for humans and potentially contaminated goods to move rapidly across the globe complicates the task of identifying the source of an infection or outbreak. Population genetic dynamics of B. pseudomallei are particularly complicated relative to other bacterial pathogens, but the work here provides the ability for broad scale population assignment. As there is currently no independent empirical measure of successful population assignment, we provide comprehensive analytical details of our comparisons to enable the reader to evaluate the robustness of population designations and assignments as they pertain to individual research questions. Finer scale subdivision and verification of current population compositions will likely be possible with genotyping data that more comprehensively samples the genome. The approach used here may be valuable for other non-clonal pathogens that lack simple group-defining genetic characteristics and provides a rapid reference for epidemiologists wishing to track the origin of infection without the need to compile population data and learn population assignment algorithms.


Conflict of interest statement

The authors have declared that no competing interests exist.

Figures

Figure 1
Figure 1. Estimated population assignments of B. pseudomallei genotypes based on multilocus sequence typing data and Structure.
Each thin vertical line represents one sequence type (ST) and is divided into K portions (based on color) that represent the likelihood of assignment into K populations. STs are sorted by probability of assignment into Population 1 (predominantly Australian STs) when K = 2. Two black vertical lines show thresholds of 95% probability of assignment. We considered STs with assignment probabilities below these thresholds to be “undefined”. The pie charts indicate the geographical sources of STs that comprise each group. Rest-of-the-world (ROW, shown in light grey) is composed of STs that were isolated from regions other than Australia (illustrated as the white slice) or Southeast Asia (shown as the dark grey slice) according to the public MLST database (http://bpseudomallei.mlst.net/).
Figure 2
Figure 2. Estimated population assignments and comparisons using BAPS and Structure simulations.
(A) Likelihood of ST assignment into two populations by Structure (top) and three populations by BAPS (bottom). The order of STs in both plots are the same and sorted by probability of assignment into Population 1 by Structure. Each thin vertical line represents one ST and is divided into two and three portions (for Structure and BAPS respectively) that represent the likelihood of assignment into each population. (B) A comparison of Structure and BAPS results. STs placed by both programs into Population 1 are shown in red and Population 2 (Populations 2a and 2b given by BAPS) are represented in green. The discrepant assignments by the two programs are shown as circles where a red interior denotes assignment into Population 1 by Structure and a green interior denotes assignment into Population 2 by Structure. (C) A breakdown of BAPS Populations 1, 2a, and 2b according to BAPS results and source data on the MLST database. The white region denotes Australian STs, the light grey region represents the ROW STs, and the dark grey color represents the Southeast Asian STs.
Figure 3
Figure 3. Population assignments of STs using GenAlEx and assignment discrepancies with Structure.
Charts (A–C) represent the log likelihood of assignment of each ST by GenAlEx. A priori population designations were made with Structure and those STs assigned to a population in 100% of iterations (A), ≥95% of iterations (B), and ≥50% of iterations (C). STs with a priori designation as Population 1 are shown in red while those designated as from Population 2 are shown in green. STs with a log likelihood of assignment as calculated by GenAlEx that was in disagreement with Structure assignments are outlined in black. See text for a discussion on ST339 and ST660 indicated in A and C. (D) The relationship between % confidence and discrepancies between Structure and GenAlEx, between Structure results and published origin in the MLST database, and with the estimate of the population genetic differentiation (ΦPT).
Figure 4
Figure 4. Population assignments of STs using GenAlEx and assignment discrepancies with BAPS.
STs from the three (K = 3) populations identified by BAPs were assigned to three populations in GenAlEx. Charts (A–C) represent the log likelihood of assignment of each ST by GenAlEx. A priori population designations were made with BAPS and those STs assigned to a population in 100% of iterations (A), ≥95% of iterations (B), and ≥50% of iterations (C). STs with a priori designation as Population 1 are shown in red, Population 2a STs are shown in green, and Population 2b are shown in yellow. STs with a log likelihood of assignment as calculated by GenAlEx that are in disagreement with BAPS assignments are outlined in black. Some discrepancies may not be visible due to the three-dimensional structure of the figure. (D) The relationship between % confidence and discrepancies between BAPS and GenAlEx, discrepancies between BAPS results and published origin in the MLST database, and with the estimate of the genetic differentiation between populations (ΦPT).

References

    1. Currie BJ, Dance DAB, Cheng AC. The global distribution of Burkholderia pseudomallei and melioidosis: an update. Trans R Soc Trop Med Hyg. 2008;102:S1–S4. - PubMed
    1. Aldhous P. Tropical medicine: melioidosis? Never heard of it. Nature. 2005;434:692–693. - PubMed
    1. Tuanyok A, Auerbach RK, Brettin TS, Bruce DC, Munk AC, et al. A horizontal gene transfer event defines two distinct groups within Burkholderia pseudomallei that have dissimilar geographic distributions. J Bacteriol. 2007;189:9044–9049. - PMC - PubMed
    1. White NJ. Melioidosis. Lancet. 2003;361:1715–1722. - PubMed
    1. Cheng AC, Currie BJ. Melioidosis: epidemiology, pathophysiology, and management. Clin Microbiol Rev. 2005;18:383–416. - PMC - PubMed

Publication types