

doi: 10.1186/gb-2011-12-12-r122.
Accurate proteome-wide protein quantification from high-resolution 15N mass spectra
Affiliations
- PMID: 22182234
- PMCID: PMC3334617
- DOI: 10.1186/gb-2011-12-12-r122
Item in Clipboard
Accurate proteome-wide protein quantification from high-resolution 15N mass spectra
Genome Biol.
.
Abstract
In quantitative mass spectrometry-based proteomics, the metabolic incorporation of a single source of 15N-labeled nitrogen has many advantages over using stable isotope-labeled amino acids. However, the lack of a robust computational framework for analyzing the resulting spectra has impeded wide use of this approach. We have addressed this challenge by introducing a new computational methodology for analyzing 15N spectra in which quantification is integrated with identification. Application of this method to an Escherichia coli growth transition reveals significant improvement in quantification accuracy over previous methods.
Figures
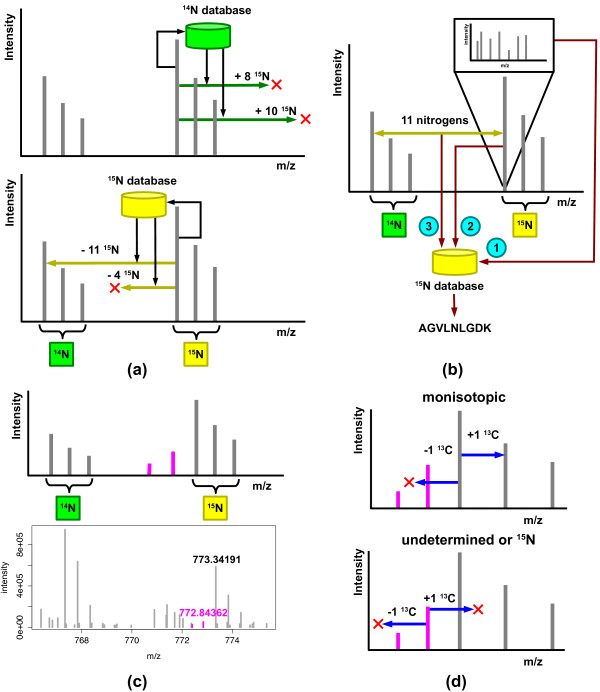
Approach for peptide quantification using 15N mass spectra. (a) The method uses accurate mass and charge measurements to search a 14N-unlabeled database and a 15N database of intact peptide masses and nitrogen counts obtained by in silico digestion of an organism's proteome. The number of nitrogens in each of the returned peptides is used to examine a limited number of mass differences designated by arrows. On finding an unambiguous 14N-15N pair, the method labels each member of the pair as originating from either the unlabeled or the 15N-labeled sample. (b) During peptide identification, a fragmentation spectrum (1) associated with a member of the pair is searched against an unlabeled database or 15N-labeled database of peptides based on the assigned label status. Note that only one member of the peptide pair needs to have an associated fragmentation spectrum. The monoisotopic masses of the peptides (2) and their nitrogen composition (3) are used to limit the search space of peptides scored against the spectrum. The intensity of each member of a 14N-15N pair is used to derive a peptide ratio. (c) Top, a population of incompletely labeled peptides can generate a complex isotope distribution pattern for 15N-labeled peptides. The peaks in purple, in order of decreasing m/z, correspond to peptides lacking one and two labeled nitrogens. Bottom, even in highly enriched samples, such peaks can be found in real mass spectra as illustrated for a +2 charge peptide, LGFFETVDTDTQR from E. coli protein yaeT (b0177). (d) For a range of charge states, monoisotopic XICs can be paired with an XIC with an additional 13C, but lack any XICs detected at a negative 13C shift (top). In contrast, 15N XICs will lack both XICs at negative and positive 13C shifts (bottom).
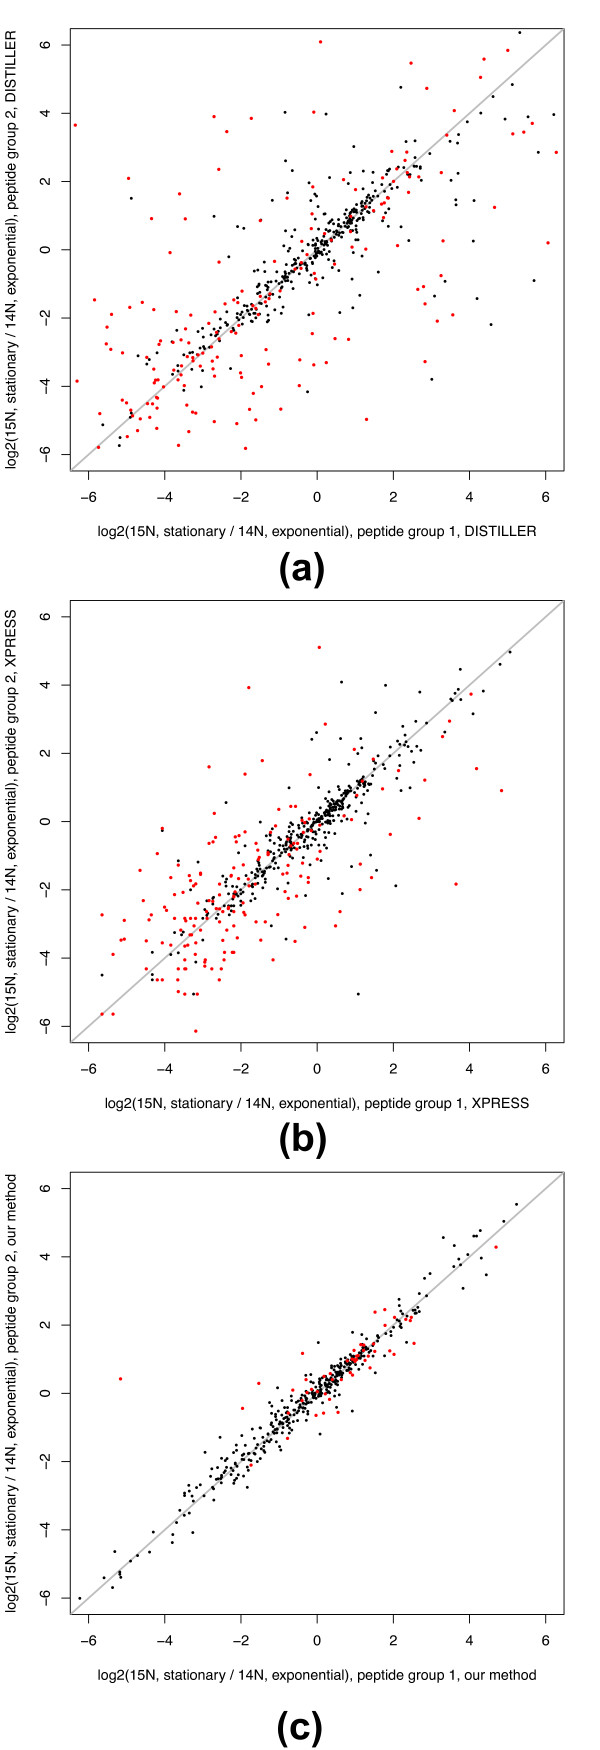
Comparison with XPRESS and Mascot Distiller. (a-c) Correlation of log2 ratios between distinct peptides from the same protein obtained by Mascot Distiller (a) [16], XPRESS (b) [10], and our method (c). Peptides from each protein were randomly assigned to two groups for this comparison of log2 ratios of peptides in group 1 versus log2 ratios of peptides in group 2. Multiple measurements (for example, charge states) of the same peptide, when present, were collated and given a median log2 ratio prior to forming the peptide groups. Black points designate proteins identified and quantified by both methods, and red points designate proteins identified and quantified that were specific to each method. The diagonal gray line designates perfect correlation.
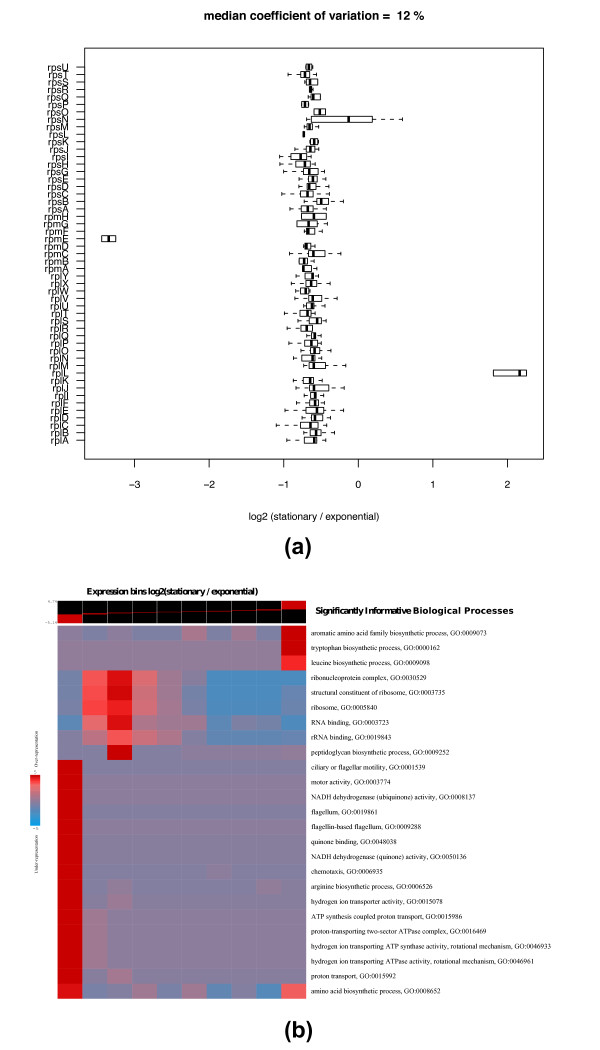
Ribosomal protein co-regulation and functional enrichment analysis of protein expression ratios. (a) Box and whisker plot of the log2 ratios of stationary over exponential phase for 51 ribosomal proteins from the low solubility protein fraction. Boxes designate the quartiles. The thick centerline designates the median. Thin lines illustrate the range. (b) A graphical representation of the functional enrichment analysis method from [19] applied to protein expression ratios comparing stationary to exponential phase of growth in E. coli computed by our method. In this representation, rows correspond to significantly informative pathways and columns correspond to 10 equally populated expression bins of log2 ratios (stationary over exponential). Colors indicate pathway over or under-representation levels across the expression bins. Red designates (in log10) over-representation of a particular pathway in any expression bin, whereas, blue designates under-representation.
