

Genome-wide transcriptional profiling of peripheral blood leukocytes from cattle infected with Mycobacterium bovis reveals suppression of host immune genes
- PMID: 22182502
- PMCID: PMC3292584
- DOI: 10.1186/1471-2164-12-611
Genome-wide transcriptional profiling of peripheral blood leukocytes from cattle infected with Mycobacterium bovis reveals suppression of host immune genes
Abstract
Background: Mycobacterium bovis is the causative agent of bovine tuberculosis (BTB), a pathological infection with significant economic impact. Recent studies have highlighted the role of functional genomics to better understand the molecular mechanisms governing the host immune response to M. bovis infection. Furthermore, these studies may enable the identification of novel transcriptional markers of BTB that can augment current diagnostic tests and surveillance programmes. In the present study, we have analysed the transcriptome of peripheral blood leukocytes (PBL) from eight M. bovis-infected and eight control non-infected age-matched and sex-matched Holstein-Friesian cattle using the Affymetrix® GeneChip® Bovine Genome Array with 24,072 gene probe sets representing more than 23,000 gene transcripts.
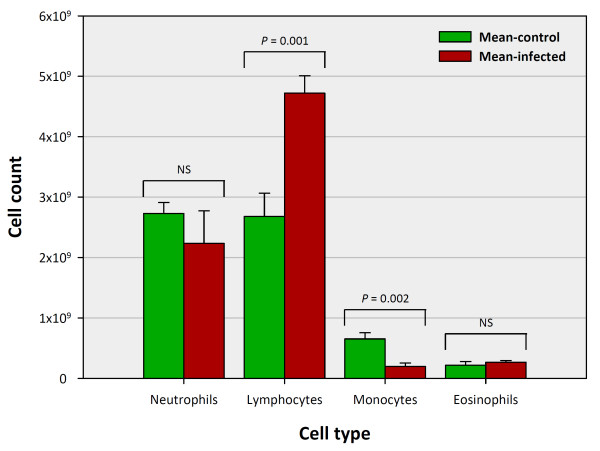
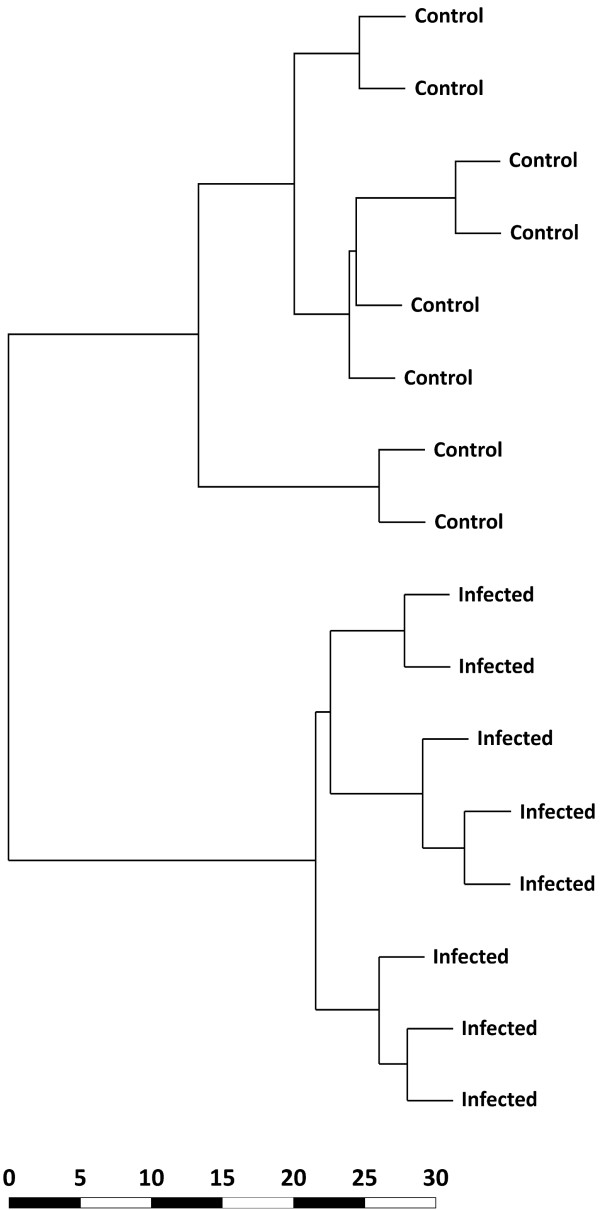
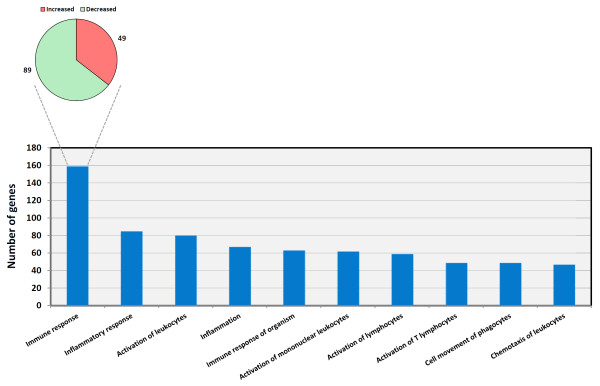
Results: Control and infected animals had similar mean white blood cell counts. However, the mean number of lymphocytes was significantly increased in the infected group relative to the control group (P = 0.001), while the mean number of monocytes was significantly decreased in the BTB group (P = 0.002). Hierarchical clustering analysis using gene expression data from all 5,388 detectable mRNA transcripts unambiguously partitioned the animals according to their disease status. In total, 2,960 gene transcripts were differentially expressed (DE) between the infected and control animal groups (adjusted P-value threshold ≤ 0.05); with the number of gene transcripts showing decreased relative expression (1,563) exceeding those displaying increased relative expression (1,397). Systems analysis using the Ingenuity® Systems Pathway Analysis (IPA) Knowledge Base revealed an over-representation of DE genes involved in the immune response functional category. More specifically, 64.5% of genes in the affects immune response subcategory displayed decreased relative expression levels in the infected animals compared to the control group.
Conclusions: This study demonstrates that genome-wide transcriptional profiling of PBL can distinguish active M. bovis-infected animals from control non-infected animals. Furthermore, the results obtained support previous investigations demonstrating that mycobacterial infection is associated with host transcriptional suppression. These data support the use of transcriptomic technologies to enable the identification of robust, reliable transcriptional markers of active M. bovis infection.
Figures
Similar articles
-
RNA-seq Transcriptional Profiling of Peripheral Blood Leukocytes from Cattle Infected with Mycobacterium bovis.Front Immunol. 2014 Aug 26;5:396. doi: 10.3389/fimmu.2014.00396. eCollection 2014. Front Immunol. 2014. PMID: 25206354 Free PMC article.
-
Innate gene repression associated with Mycobacterium bovis infection in cattle: toward a gene signature of disease.BMC Genomics. 2007 Oct 31;8:400. doi: 10.1186/1471-2164-8-400. BMC Genomics. 2007. PMID: 17974019 Free PMC article.
-
Antigen stimulation of peripheral blood mononuclear cells from Mycobacterium bovis infected cattle yields evidence for a novel gene expression program.BMC Genomics. 2008 Sep 29;9:447. doi: 10.1186/1471-2164-9-447. BMC Genomics. 2008. PMID: 18823559 Free PMC article.
-
Gene expression profiling of the host response to Mycobacterium bovis infection in cattle.Transbound Emerg Dis. 2009 Aug;56(6-7):204-14. doi: 10.1111/j.1865-1682.2009.01082.x. Epub 2009 May 26. Transbound Emerg Dis. 2009. PMID: 19486308 Review.
-
Cell-Mediated Immunological Biomarkers and Their Diagnostic Application in Livestock and Wildlife Infected With Mycobacterium bovis.Front Immunol. 2021 Mar 4;12:639605. doi: 10.3389/fimmu.2021.639605. eCollection 2021. Front Immunol. 2021. PMID: 33746980 Free PMC article. Review.
Cited by
-
Biomarkers for Detecting Resilience against Mycobacterial Disease in Animals.Infect Immun. 2019 Dec 17;88(1):e00401-19. doi: 10.1128/IAI.00401-19. Print 2019 Dec 17. Infect Immun. 2019. PMID: 31527123 Free PMC article. Review.
-
Global gene expression and systems biology analysis of bovine monocyte-derived macrophages in response to in vitro challenge with Mycobacterium bovis.PLoS One. 2012;7(2):e32034. doi: 10.1371/journal.pone.0032034. Epub 2012 Feb 22. PLoS One. 2012. PMID: 22384131 Free PMC article.
-
Whole Blood Transcriptome Analysis of Mycoplasma mycoides Subsp. mycoides-Infected Cattle Confirms Immunosuppression but Does Not Reflect Local Inflammation.PLoS One. 2015 Oct 2;10(10):e0139678. doi: 10.1371/journal.pone.0139678. eCollection 2015. PLoS One. 2015. PMID: 26431338 Free PMC article.
-
RNA-Seq Transcriptome Analysis of Peripheral Blood From Cattle Infected With Mycobacterium bovis Across an Experimental Time Course.Front Vet Sci. 2021 May 28;8:662002. doi: 10.3389/fvets.2021.662002. eCollection 2021. Front Vet Sci. 2021. PMID: 34124223 Free PMC article.
-
In-depth systems biological evaluation of bovine alveolar macrophages suggests novel insights into molecular mechanisms underlying Mycobacterium bovis infection.Front Microbiol. 2022 Nov 30;13:1041314. doi: 10.3389/fmicb.2022.1041314. eCollection 2022. Front Microbiol. 2022. Retraction in: Front Microbiol. 2025 Apr 10;16:1605607. doi: 10.3389/fmicb.2025.1605607. PMID: 36532492 Free PMC article. Retracted.
References
-
- Gormley E, Doyle MB, McGill K, Costello E, Good M, Collins JD. The effect of the tuberculin test and the consequences of a delay in blood culture on the sensitivity of a gamma-interferon assay for the detection of Mycobacterium bovis infection in cattle. Vet Immunol Immunopathol. 2004;102(4):413–420. doi: 10.1016/j.vetimm.2004.08.002. - DOI - PubMed
Publication types
MeSH terms
LinkOut - more resources
Full Text Sources
Molecular Biology Databases
