. 2012 Mar 1;590(5):1101-19.
doi: 10.1113/jphysiol.2011.221358. Epub 2011 Dec 19.

A self-limiting regulation of vasoconstrictor-activated TRPC3/C6/C7 channels coupled to PI(4,5)P₂-diacylglycerol signalling

Affiliations

A self-limiting regulation of vasoconstrictor-activated TRPC3/C6/C7 channels coupled to PI(4,5)P₂-diacylglycerol signalling

Yuko Imai et al. J Physiol. .

Abstract

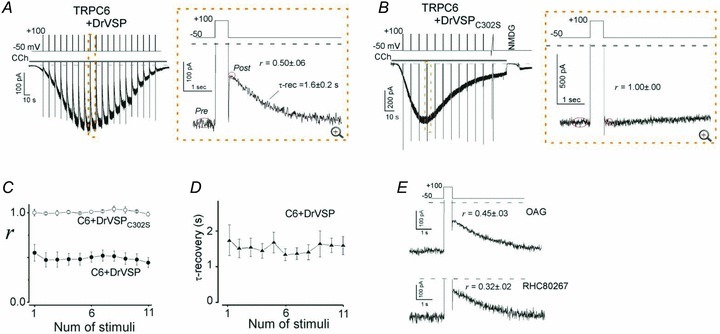
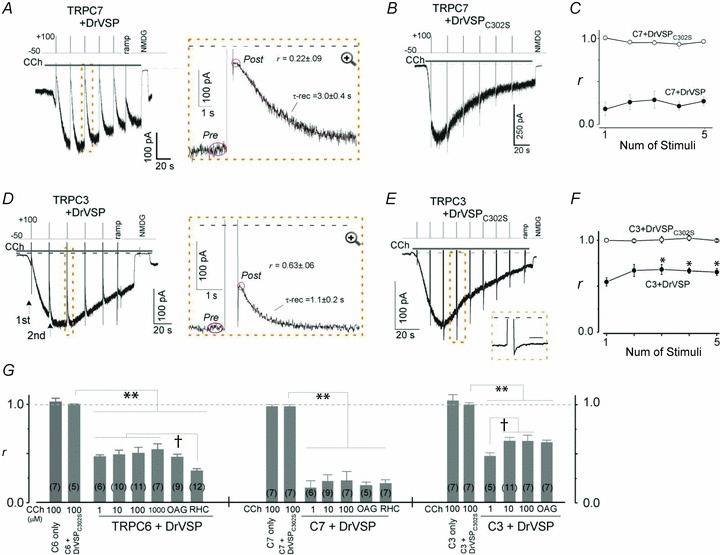
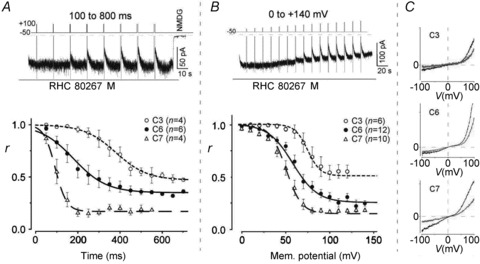
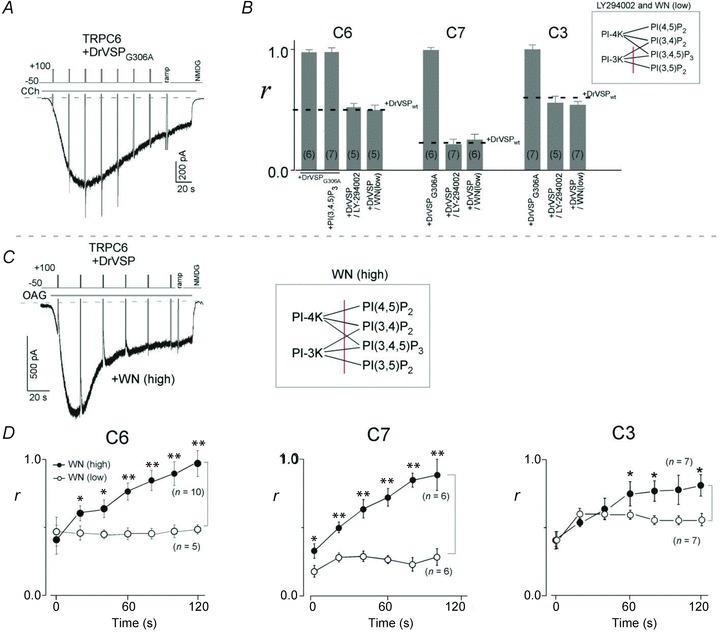
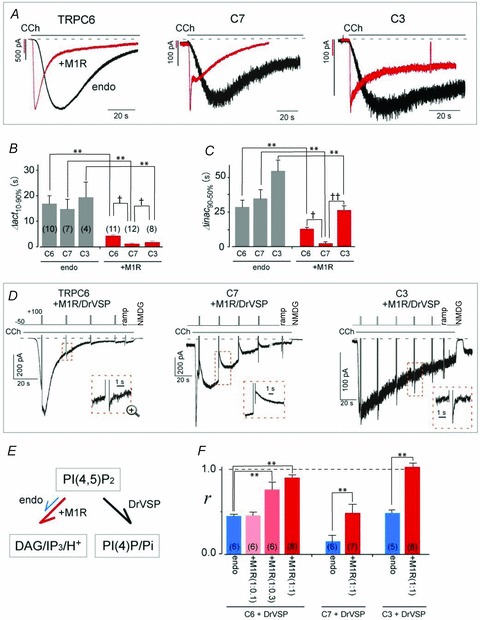
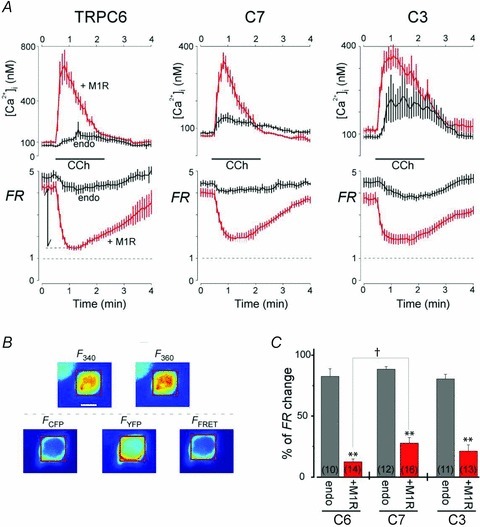
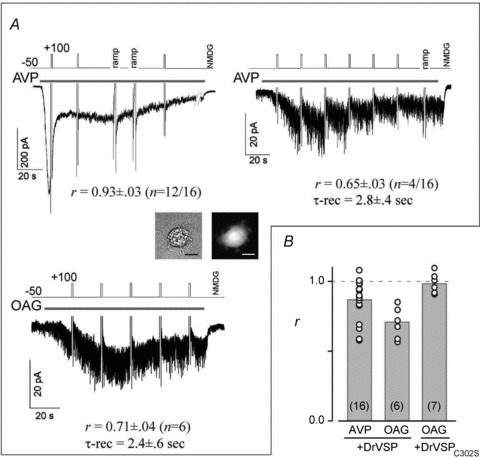
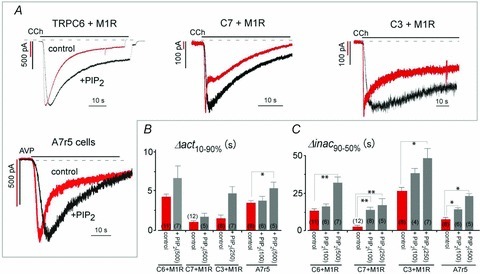
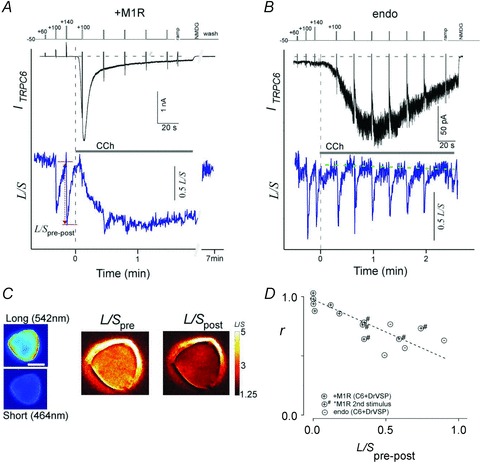
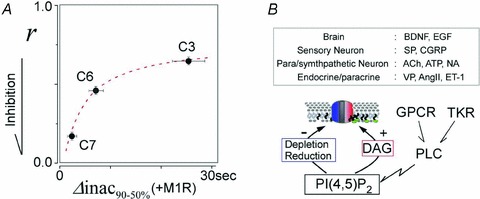
Activation of transient receptor potential (TRP) canonical TRPC3/C6/C7 channels by diacylglycerol (DAG) upon stimulation of phospholipase C (PLC)-coupled receptors results in the breakdown of phosphoinositides (PIPs). The critical importance of PIPs to various ion-transporting molecules is well documented, but their function in relation to TRPC3/C6/C7 channels remains controversial. By using an ectopic voltage-sensing PIP phosphatase (DrVSP), we found that dephosphorylation of PIPs robustly inhibits currents induced by carbachol (CCh), 1-oleolyl-2-acetyl-sn-glycerol (OAG) or RHC80267 in TRPC3, TRPC6 and TRPC7 channels, though the strength of the DrVSP-mediated inhibition (VMI) varied among the channels with a rank order of C7>C6>C3. Pharmacological and molecular interventions suggest that depletion of phosphatidylinositol 4,5-bisphosphate (PI(4,5)P₂) is most likely the critical event for VMI in all three channels.When the PLC catalytic signal was vigorously activated through overexpression of the muscarinic type-I receptor (M1R), the inactivation of macroscopic TRPC currents was greatly accelerated in the same rank order as the VMI, and VMI of these currents was attenuated or lost. VMI was also rarely detected in vasopressin-induced TRPC6-like currents inA7r5 vascular smooth muscle cells, indicating that the inactivation by PI(4,5)P₂ depletion underlies the physiological condition. Simultaneous fluorescence resonance energy transfer (FRET)-based measurement of PI(4,5)P₂ levels and TRPC6 currents confirmed that VMI magnitude reflects the degree of PI(4,5)P₂ depletion. These results demonstrate that TRPC3/C6/C7 channels are differentially regulated by depletion of PI(4,5)P₂, and that the bimodal signal produced by PLC activation controls these channels in a self-limiting manner.


Figures

Figure 1
Figure 1. DrVSP-mediated inhibition (VMI) of TRPC6 currents
A, current evoked by carbachol (CCh; 100 μm) recorded in the whole-cell mode from cells transfected with TRPC6 and DrVSP (left). Depolarization (+100 mV, 500 ms) was applied every 10 s (protocol displayed above). The area enclosed by the dashed box is enlarged in the right panel. Tail and outward currents are clipped to the frame here and throughout. B, data from cells transfected with TRPC6 and the enzyme-defective mutant DrVSPC302S. The conditions are the same as in A.C, averaged VMI elicited by repetitive depolarization in the presence of DrVSP (filled circles; n = 11) and DrVSPC302S (open circles; n = 5). D, averaged time constants of a single-exponential fit to the recovery from VMI. E, VMI of OAG (100 μm)- and RHC (100 μm)-induced TRPC6 currents (upper and lower panel, respectively). All VMI data are summarized in Fig. 2G and Table 1.
Figure 2
Figure 2. VMI of TRPC7 and TRPC3 currents
AC and DF, the conditions are largely the same as in Fig. 1AC, except that for TRPC7 and TRPC3 the intervals between depolarizations are 20 s. G, summary of DrVSP effects on TRPC6 (left), C7 (middle) and C3 (right). The inhibition ratio (r) in the bar graph is averaged from the median r value for each cell, here and throughout. The numbers in parentheses indicate the numbers of cells averaged. Numbers at the bottom indicate the CCh concentration (μm). Asterisks indicate statistical significance (**P < 0.001 vs. Cx + DrVSPC302S). The daggers indicate statistically significant differences among the significant inhibition group (†P < 0.05).
Figure 3
Figure 3. Pulse-duration and voltage-step protocols reproduce the differential VMI of TRPC3/C6/C7 channels
A, top; typical example of time-dependent VMI of a RHC80267-induced TRPC6 current. Bottom; time dependence of the VMI (r) of TRPC3/C6/C7-derived currents. TRPC6 or C7 and C3 were evoked by external application of RHC80267 (100 μm) and OAG (100 μm), respectively. B, top; example of voltage-dependent VMI of a RHC-induced TRPC6 current. Bottom; voltage-dependence of VMI (r) of TRPC3/C6/C7-derived currents. The agonists were the same as in A for the respective currents. C, typical I–V relationships for TRPC3/C6/C7 currents generated using a ramp protocol before (black) and just after VMI (grey).
Figure 4
Figure 4. Identification of PI(4,5)P2 as the cause of VMI
A, co-transfected PTEN-like DrVSPG306A exhibited no ability to dephosphorylate PI(4,5)P2 and failed to inhibit TRPC6 currents. B, summary of the effects of DrVSPG306A and LY-294002. No inhibition of any TRPC channel was detected by the activation of DrVSPG306A, even with additional PI(3,4,5)P3 in the patch pipette. Pretreatment (for 0.5 h) with LY-294002 (50 μm) or a low concentration of wortmannin (WN) had no effect on the VMI of the respective currents. C, loss of VMI of TRPC6, C7 and C3 currents after pretreatment for several minutes with a high concentration of WN (50 μm). Currents were evoked by external application of OAG (30 μm). D, time dependence of the attenuation of VMI (r) by a high concentration of WN (filled circles). The time after the first depolarization was set to zero. **P < 0.001 and *P < 0.05 vs. the identical time in low WN (5 μm; open circles).
Figure 5
Figure 5. Effect of vigorous PLC stimulation in cells overexpressing M1R on VMI
A, typical example of currents elicited by CCh (10 μm) in HEK293 cells transfected with TRPC6 (left), C7 (middle) or C3 (right) channels, with (red trace) and without (black trace) muscarinic receptor type-I (M1R). Membrane potentials were held at −50 mV. Comparison of the activation (B) and inactivation (C) kinetics obtained from A (†P < 0.05 **P < 0.001 by t test). D, co-transfection of M1R eliminates VMI of TRPC6 (left) and C3 (right) currents and reduces C7 currents (middle). E, PI(4,5)P2 catalytic schemes for GqPCR (red arrow: M1R co-transfection, blue arrow: no exogenous GqPCR) and DrVSP (black arrow), which lead to production of DAG/IP3/H+ and PI(4)P/Pi, respectively. F, summary of the mean VMI (r) from Fig. 5D. Blue bars represent the transient inhibition of CCh-evoked (1 μm) currents in HEK293 cells expressing only endogenous M1R. The ratio of the expression vectors (TRPC:M1R) is shown below ‘+M1R’, in parentheses.
Figure 6
Figure 6. Measurement of CCh-induced [Ca2+]i and PIP2 dynamics
A, simultaneous cell imaging of CCh (100 μm)-induced changes in [Ca2+]i (upper) using Fura-2 and PI(4,5)P2 using FRET (FR, lower) of eCFP- and eYFP-PH domain proteins for TRPC6 (left), C7 (middle) and C3 (right). HEK293 cells were co-transfected with the indicated TRPC channels and PIP2-sensing proteins, with or without M1R (red and black traces, respectively). FR is the fractional increase of YFP emission due to FRET. Ca2+-dependent Fura-2 bleed-through was subtracted from the FRET signals (see Methods). B, representative images used for Fura-2 (upper panels; F340 and F360) and FRET measurements (bottom panels; FCFP, FYFP and FFRET). The scale bar in the F340 panel is 10 μm. Fura-2 and FR were determined using the same ROI (red square). C, summary of fold changes in FR from initial baseline to the minimum elicited by CCh stimulation. **P < 0.001 vs. no co-transfection of M1R with unpaired t test, †P < 0.05).
Figure 7
Figure 7. VMI in A7r5 aortic smooth muscle cells
A, depolarization had almost no effect on TRPC6-like currents elicited in A7r5 cells by 50 nm AVP (left top, 12 of 16 cells). Co-transfection of the cells with DrVSP was confirmed by GFP expression (inset: bright-field (left) and GFP fluorescence (right)). A few cells exhibited clear VMI (right, 4 of 16 cells). OAG-induced currents also exhibited substantial VMI (left bottom). B, summary of VMI of AVP- and OAG-induced currents. VMI measured in each A7r5 cell (open circles); grey bars indicate the means of the VMI. Cells co-transfected with DrVSPC302S exhibited no VMI of OAG-induced currents.
Figure 8
Figure 8. Effect of PIP2 in patch pipettes in M1R transfectants and A7r5 cells
A, black traces (+PIP2) are typical examples recorded in M1R-expressing HEK293 cells with water-soluble PI(4,5)P2 in the patch pipettes (500 μm diC8-PIP2 for TRPC6, 250 μm for C3 and 100 μm for C7). All of the currents exhibited slower decay than currents recorded without diC8-PIP2 (red traces). Currents elicited by AVP (50 nm) in A7r5 cells exhibited slower activation and inactivation with 100 μm diC8-PIP2 in the pipette (left bottom). Membrane potentials were held at −50 mV. B and C, effect of diC8-PIP2 on channel activation (B) and inactivation (C) time courses. **P < 0.001, *P < 0.05 vs. control (i.e. no diC8-PIP2 in the patch pipette).
Figure 9
Figure 9. Simultaneous detection of TRPC6 currents (ITRPC6) and PIP2
HEK293 cells were co-transfected with TRPC6 channels, PIP2-sensing eCFP/eYFP-PH proteins and DrVSP, with (A) and without (B) M1R. ITRPC6 (upper panel) and FRET between eCFP-PH and eYFP-PH domain (lower panel) signals were simultaneously collected. Depolarization pulses from the holding potential to +60 to +140 mV (40 mV steps) were delivered prior to agonist stimulation (1 μm CCh in A and 10 μm CCh in B). Robust VMI and FRET changes elicited by repetitive depolarizations were observed in cells expressing only endogenous M1R (B) but not in cells co-transfected with M1R (A). C, representative images of the long- and short-wavelength emission (left). FRET ratio (L/S) images were obtained using Flong and Fshort before (L/Spre) and after the depolarization (L/Spost) (right). Data correspond to changes in A (red arrow). D, VMI of ITRPC6 (r) plotted against FRET changes (L/Spre-post) elicited in the presence of CCh stimulation in cells, with (circles with +) and without (endo; circles with –) co-transfection of M1R. # indicates data from secondary CCh-evoked currents from M1R transfectants.
Figure 10
Figure 10. Schematic diagram for autonomic regulation
A, VMI in the currents recorded from the endogenous stimulation of HEK293 cells (r, Y-axis) plotted against the fast inactivation in the M1R-overexpressing HEK293 cells (Δinac90-50, X-axis) of the respective TRPC channels. Data obtained at 10 μm CCh-induced currents were used. A curvature relation was observed between VMI and the current decay (dotted line, curve fitting by double exponential formula). B, schematic diagram of the autonomic regulation of TRPC3/C6/C7 channel activity by PI(4,5)P2. Agonists released from various organs are listed in the upper box. Receptors for these agonists (GqPCR or TKR (tyrosine kinase receptor)) activate PLC, leading to DAG production and reduction or depletion of PI(4,5)P2. As PLC activity increases, bimodal signals from PI(4,5)P2 accelerates the channel opening and closing.

Similar articles

Cited by

References

    1. Albert AP, Saleh SN, Large WA. Inhibition of native TRPC6 channel activity by phosphatidylinositol 4,5-bisphosphate in mesenteric artery myocytes. J Physiol. 2008;586:3087–3095. - PMC - PubMed
    1. Balla T, Szentpetery Z, Kim YJ. Phosphoinositide signaling: new tools and insights. Physiology (Bethesda) 2009;24:231–244. - PMC - PubMed
    1. Becker EB, Oliver PL, Glitsch MD, Banks GT, Achilli F, Hardy A, Nolan PM, Fisher EM, Davies KE. A point mutation in TRPC3 causes abnormal Purkinje cell development and cerebellar ataxia in moonwalker mice. Proc Natl Acad Sci U S A. 2009;106:6706–6711. - PMC - PubMed
    1. Ben-Chaim Y, Chanda B, Dascal N, Bezanilla F, Parnas I, Parnas H. Movement of ‘gating charge’ is coupled to ligand binding in a G-protein-coupled receptor. Nature. 2006;444:106–109. - PubMed
    1. Ben-Mabrouk F, Tryba AK. Substance P modulation of TRPC3/7 channels improves respiratory rhythm regularity and ICAN-dependent pacemaker activity. Eur J Neurosci. 2010;31:1219–1232. - PMC - PubMed

Publication types

MeSH terms