

AM₁-receptor-dependent protection by intermedin of human vascular and cardiac non-vascular cells from ischaemia-reperfusion injury
- PMID: 22183724
- PMCID: PMC3381824
- DOI: 10.1113/jphysiol.2011.221895
AM₁-receptor-dependent protection by intermedin of human vascular and cardiac non-vascular cells from ischaemia-reperfusion injury
Abstract
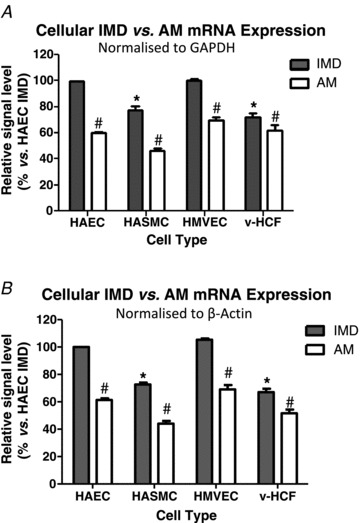
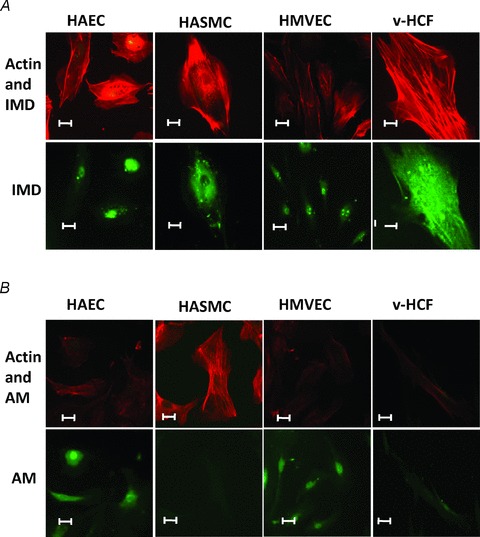
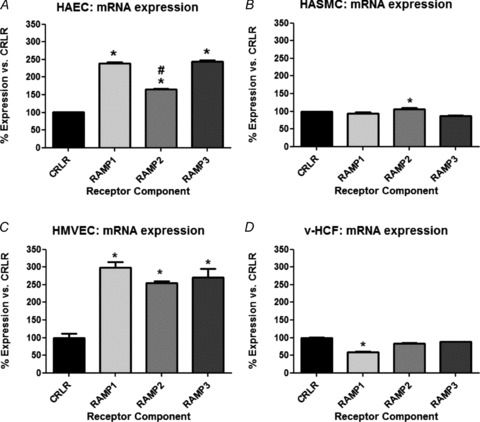
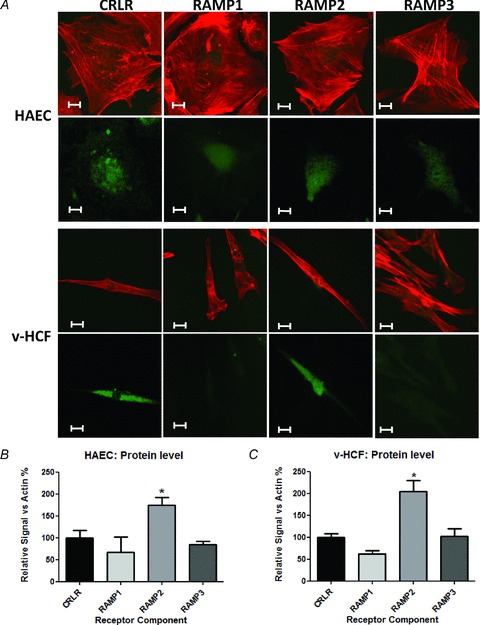
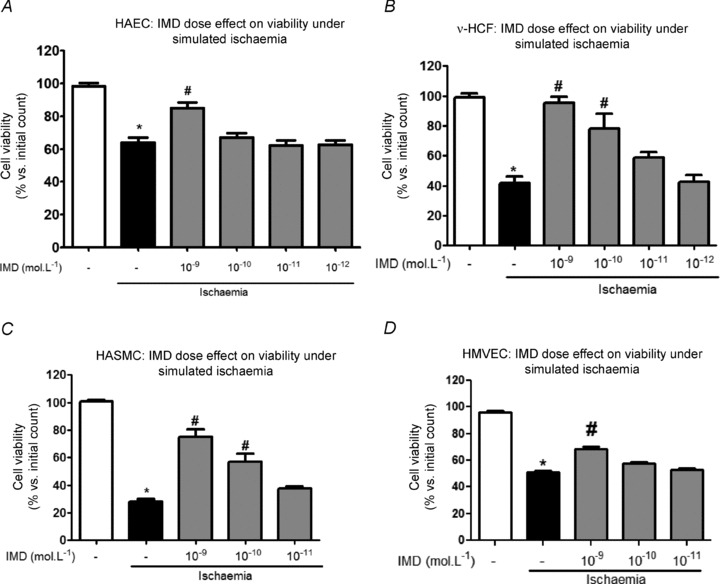
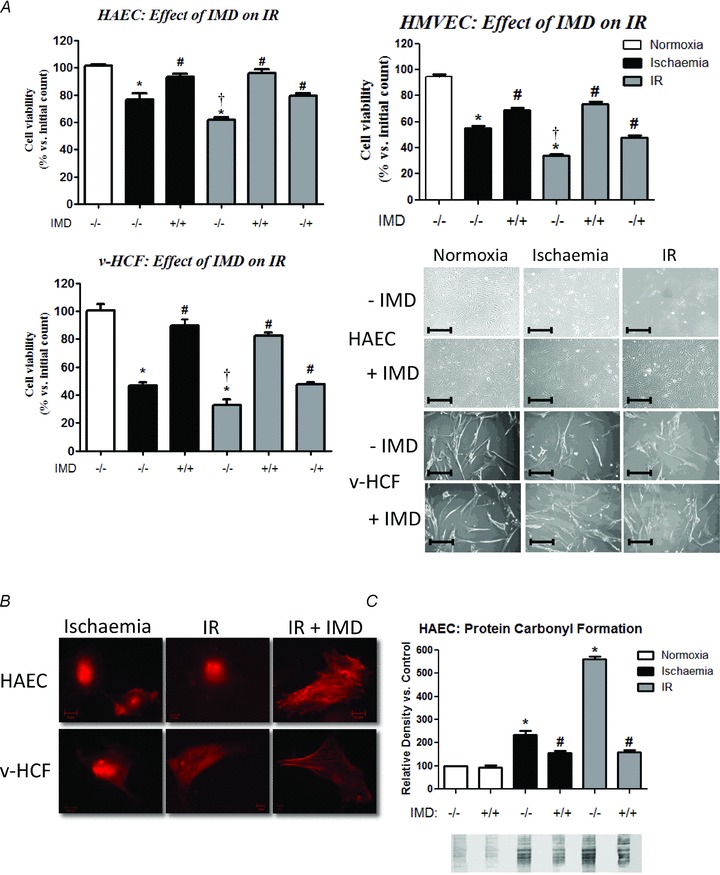
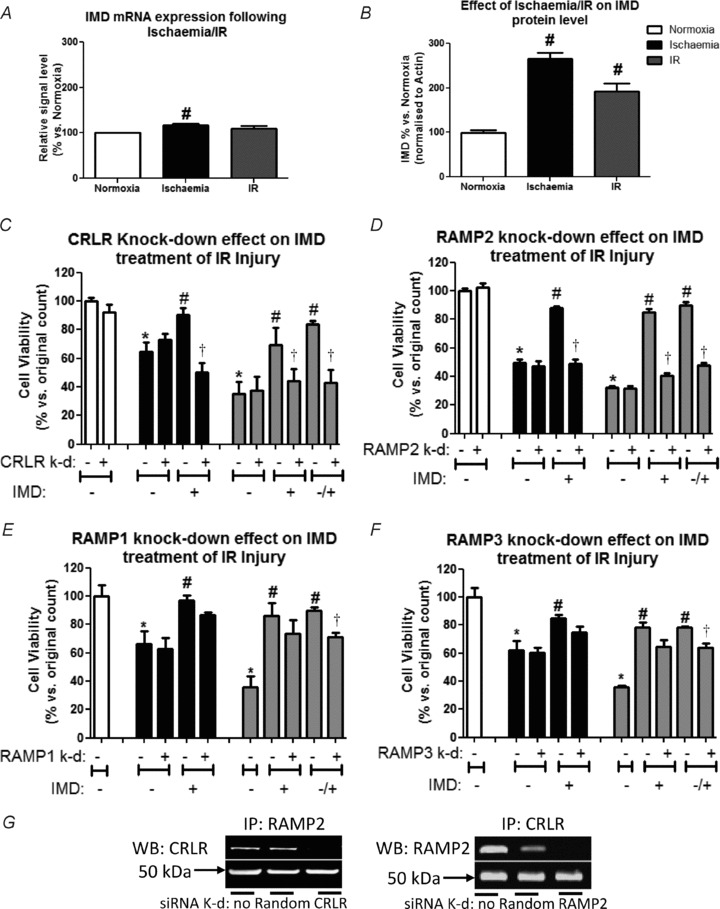
Intermedin (IMD) protects rodent heart and vasculature from oxidative stress and ischaemia. Less is known about distribution of IMD and its receptors and the potential for similar protection in man. Expression of IMD and receptor components were studied in human aortic endothelium cells (HAECs), smooth muscle cells (HASMCs), cardiac microvascular endothelium cells (HMVECs) and fibroblasts (v-HCFs). Receptor subtype involvement in protection by IMD against injury by hydrogen peroxide (H₂O₂, 1 mmol l⁻¹) and simulated ischaemia and reperfusion were investigated using receptor component-specific siRNAs. IMD and CRLR, RAMP1, RAMP2 and RAMP3 were expressed in all cell types.When cells were treated with 1 nmol l⁻¹ IMD during exposure to 1 mmol l⁻¹ H₂O₂ for 4 h, viability was greater vs. H2O2 alone (P<0.05 for all cell types). Viabilities under 6 h simulated ischaemia differed (P<0.05) in the absence and presence of 1 nmol l⁻¹ IMD: HAECs 63% and 85%; HMVECs 51% and 68%; v-HCFs 42% and 96%. IMD 1 nmol l⁻¹ present throughout ischaemia (3 h) and reperfusion (1 h) attenuated injury (P<0.05): viabilities were 95%, 74% and 82% for HAECs, HMVECs and v-HCFs, respectively, relative to those in the absence of IMD (62%, 35%, 32%, respectively). When IMD 1 nmol l⁻¹ was present during reperfusion only, protection was still evident (P<0.05, 79%, 55%, 48%, respectively). Cytoskeletal disruption and protein carbonyl formation followed similar patterns. Pre-treatment (4 days) of HAECs with CRLR or RAMP2, but not RAMP1 or RAMP3, siRNAs abolished protection by IMD (1 nmol l⁻¹) against ischaemia-reperfusion injury. IMD protects human vascular and cardiac non-vascular cells from oxidative stress and ischaemia-reperfusion,predominantly via AM1 receptors.
Figures

Similar articles
-
Endothelium-derived intermedin/adrenomedullin-2 protects human ventricular cardiomyocytes from ischaemia-reoxygenation injury predominantly via the AM₁ receptor.Peptides. 2016 Feb;76:1-13. doi: 10.1016/j.peptides.2015.12.005. Epub 2015 Dec 29. Peptides. 2016. PMID: 26743504
-
Protective effects of intermedin on cardiovascular, pulmonary and renal diseases: comparison with adrenomedullin and CGRP.Curr Protein Pept Sci. 2013 Jun;14(4):294-329. doi: 10.2174/13892037113149990049. Curr Protein Pept Sci. 2013. PMID: 23745696 Review.
-
Involvement of vascular endothelial growth factor signaling in CLR/RAMP1 and CLR/RAMP2-mediated pro-angiogenic effect of intermedin on human vascular endothelial cells.Int J Mol Med. 2010 Aug;26(2):289-94. doi: 10.3892/ijmm_00000464. Int J Mol Med. 2010. PMID: 20596610
-
Coexpression of calcitonin receptor-like receptor and receptor activity-modifying protein 2 or 3 mediates the antimigratory effect of adrenomedullin.Endocrinology. 2003 Feb;144(2):447-53. doi: 10.1210/en.2002-220463. Endocrinology. 2003. PMID: 12538603
-
Adrenomedullin 2/intermedin in the hypothalamo-pituitary-adrenal axis.J Mol Neurosci. 2011 Feb;43(2):182-92. doi: 10.1007/s12031-010-9413-2. Epub 2010 Jul 2. J Mol Neurosci. 2011. PMID: 20596793 Review.
Cited by
-
Implication of plasma intermedin levels in patients who underwent first-time diagnostic coronary angiography: a single centre, cross-sectional study.BMC Cardiovasc Disord. 2014 Dec 11;14:182. doi: 10.1186/1471-2261-14-182. BMC Cardiovasc Disord. 2014. PMID: 25495100 Free PMC article.
-
Intermedin in the paraventricular nucleus attenuates cardiac sympathetic afferent reflex in chronic heart failure rats.PLoS One. 2014 Apr 7;9(4):e94234. doi: 10.1371/journal.pone.0094234. eCollection 2014. PLoS One. 2014. PMID: 24709972 Free PMC article.
-
Intermedin Alleviates Diabetic Cardiomyopathy by Up-Regulating CPT-1β through Activation of the Phosphatidyl Inositol 3 Kinase/Protein Kinase B Signaling Pathway.Pharmaceuticals (Basel). 2024 Sep 12;17(9):1204. doi: 10.3390/ph17091204. Pharmaceuticals (Basel). 2024. PMID: 39338366 Free PMC article.
-
The Rationale of Neprilysin Inhibition in Prevention of Myocardial Ischemia-Reperfusion Injury during ST-Elevation Myocardial Infarction.Cells. 2020 Sep 21;9(9):2134. doi: 10.3390/cells9092134. Cells. 2020. PMID: 32967374 Free PMC article. Review.
-
Multi-biological functions of intermedin in diseases.Front Physiol. 2023 Sep 6;14:1233073. doi: 10.3389/fphys.2023.1233073. eCollection 2023. Front Physiol. 2023. PMID: 37745233 Free PMC article. Review.
References
-
- Albertin G, Sorato E, Oselladore B, Mascarin A, Tortorella C, Guidolin D. Involvement of vascular endothelial growth factor signaling in CLR/RAMP1 and CLR/RAMP2-mediated pro-angiogenic effect of intermedin on human vascular endothelial cells. Int J Mol Med. 2010;26:289–294. - PubMed
-
- Bell D, Zhao Y, McCoy FP, Devine A, McDermott BJ. Expression of the counter-regulatory peptide intermedin is augmented in the presence of oxidative stress in hypertrophied cardiomyocytes. Cell Physiol Biochem. 2008;21:409–420. - PubMed
-
- Bell D, Zhao Y, McCoy FP, Devine AB, McDermott BJ. Differential effects of an anti-oxidant intervention on cardiomyocyte expression of adrenomedullin and intermedin and their receptor components in chronic nitric oxide deficiency. Cell Physiol Biochem. 2007;20:269–282. - PubMed
-
- Cai H. Hydrogen peroxide regulation of endothelial function: origins, mechanisms, and consequences. Cardiovasc Res. 2005;68:26–36. - PubMed
Publication types
MeSH terms
Substances
LinkOut - more resources
Full Text Sources