Differential conditions for early after-depolarizations and triggered activity in cardiomyocytes derived from transgenic LQT1 and LQT2 rabbits
- PMID: 22183728
- PMCID: PMC3381823
- DOI: 10.1113/jphysiol.2011.218164
Differential conditions for early after-depolarizations and triggered activity in cardiomyocytes derived from transgenic LQT1 and LQT2 rabbits
Abstract
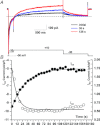
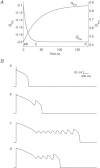
Early after-depolarization (EAD), or abnormal depolarization during the plateau phase of action potentials, is a hallmark of long-QT syndrome (LQTS). More than 13 genes have been identified as responsible for LQTS, and elevated risks for EADs may depend on genotypes, such as exercise in LQT1 vs. sudden arousal in LQT2 patients. We investigated mechanisms underlying different high-risk conditions that trigger EADs using transgenic rabbit models of LQT1 and LQT2, which lack I(Ks) and I(Kr) (slow and fast components of delayed rectifying K(+) current), respectively. Single-cell patch-clamp studies show that prolongation of action potential duration (APD) can be further enhanced by lowering extracellular potassium concentration ([K(+)](o)) from 5.4 to 3.6 mm. However, only LQT2 myocytes developed spontaneous EADs following perfusion with lower [K(+)](o), while there was no EAD formation in littermate control (LMC) or LQT1 myocytes, although APDs were also prolonged in LMC myocytes and LQT1 myocytes. Isoprenaline (ISO) prolonged APDs and triggered EADs in LQT1 myocytes in the presence of lower [K(+)](o). In contrast, continuous ISO perfusion diminished APD prolongation and reduced the incidence of EADs in LQT2 myocytes. These different effects of ISO on LQT1 and LQT2 were verified by optical mapping of the whole heart, suggesting that ISO-induced EADs are genotype specific. Further voltage-clamp studies revealed that ISO increases L-type calcium current (I(Ca)) faster than I(Ks) (time constant 9.2 s for I(Ca) and 43.6 s for I(Ks)), and computer simulation demonstrated a high-risk window of EADs in LQT2 during ISO perfusion owing to mismatch in the time courses of I(Ca) and I(Ks), which may explain why a sympathetic surge rather than high sympathetic tone can be an effective trigger of EADs in LQT2 perfused hearts. In summary, EAD formation is genotype specific, such that EADs can be elicited in LQT2 myocytes simply by lowering [K(+)](o), while LQT1 myocytes require sympathetic stimulation. Slower activation of I(Ks) than of I(Ca) by ISO may explain why different sympathetic modes, i.e. sympathetic surge vs. high sympathetic tone, are associated with polymorphic ventricular tachycardia in LQTS patients.
Figures


Comment in
-
Triggering of cardiac arrhythmic events in long QT syndrome: lessons from funny bunnies.J Physiol. 2012 Mar 15;590(6):1311-2. doi: 10.1113/jphysiol.2012.229344. J Physiol. 2012. PMID: 22422115 Free PMC article. No abstract available.
References
-
- Bailly P, Mouchonière M, Bénitah JP, Camilleri L, Vassort G, Lorente P. Extracellular K+ dependence of inward rectification kinetics in human left ventricular cardiomyocytes. Circulation. 1998;98:2753–2759. - PubMed
-
- Brunner M, Peng X, Liu GX, Ren XQ, Ziv O, Choi BR, Mathur R, Hajjiri M, Odening KE, Steinberg E, Folco EJ, Pringa E, Centracchio J, Macharzina RR, Donahay T, Schofield L, Rana N, Kirk M, Mitchell GF, Poppas A, Zehender M, Koren G. Mechanisms of cardiac arrhythmias and sudden death in transgenic rabbits with long QT syndrome. J Clin Invest. 2008;118:2246–2259. - PMC - PubMed
-
- Burashnikov A, Antzelevitch C. Block of IKs does not induce early afterdepolarization activity but promotes beta-adrenergic agonist-induced delayed after depolarization activity. J Cardiovasc Electrophysiol. 2000;11:458–465. - PubMed
-
- Chiang CE, Roden DM. The long QT syndromes: genetic basis and clinical implications. J Am Coll Cardiol. 2000;36:1–12. - PubMed
Publication types
MeSH terms
Substances
Grants and funding
LinkOut - more resources
Full Text Sources
Miscellaneous

