. 2012 Feb 15;590(4):827-44.
doi: 10.1113/jphysiol.2011.218149. Epub 2011 Dec 19.

Inhibition of voltage-gated proton channels by local anaesthetics in GMI-R1 rat microglia

Affiliations

Inhibition of voltage-gated proton channels by local anaesthetics in GMI-R1 rat microglia

Tadashi Matsuura et al. J Physiol. .

Abstract

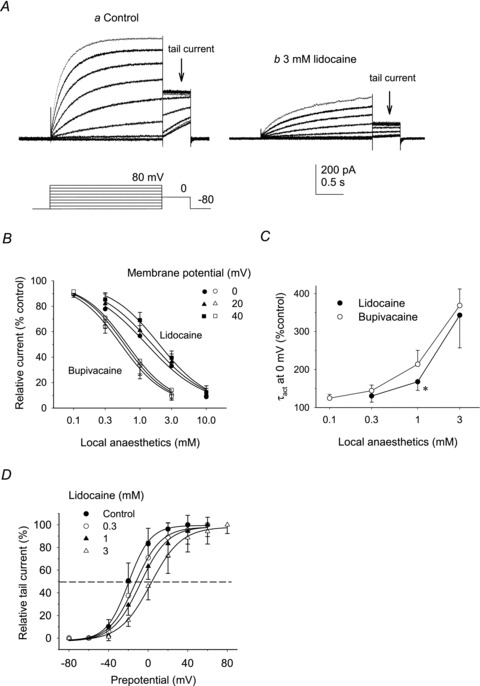
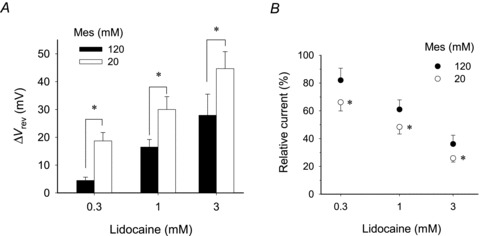
Voltage-gated proton channels play crucial roles during the respiratory burst in phagocytes, such as microglia. As local anaesthetics have a variety of anti-inflammatory properties, including inhibition of phagocytosis, they may act on the proton channels. Most local anaesthetics are tertiary amines and may affect proton channels through modification of pH(i) as weak bases. To test these hypotheses, the effects of lidocaine and bupivacaine on proton channels were examined in a rat microglial cell line (GMI-R1) as a function of pH(o) and pH(i). Both lidocaine and bupivacaine reversibly decreased the current, with IC(50) values of ∼1.2 and ∼0.5 mM, respectively, at pH(o)/pH(i) 7.3/5.5. The inhibition was enhanced with either pH(o) increase or pH(i) decrease, suggesting that the protonation of the base forms inside the cell contributed to the inhibitory effects. Both local anaesthetics shifted the reversal potentials to more positive voltages, indicating increases in pH(i). The potencies of inhibition were correlated well with the degree of increase in pH(i). The lidocaine-induced inhibition was eliminated when the pH(i) increases were cancelled by co-application of a weak acid, butyrate. The cytosolic alkalizations by lidocaine and bupivacaine were confirmed using a pH-sensitive fluorescent dye, BCECF, in non-voltage-clamped cells. Furthermore, chemiluminescence measurement proved that both anaesthetics inhibited production of reactive oxygen species by the cells. In conclusion, lidocaine and bupivacaine inhibit proton channels primarily by the weak base mechanism via an increase in pH(i). This is a novel mechanism underlying actions of local anaesthtics.


Figures

Figure 1
Figure 1. Effects of lidocaine and bupivacaine on proton currents in microglia
A, representative changes in the proton currents (left panel) and the time course (right panel) by perfusing the bath with the 3 mm lidocaine-containing solution. The ordinate indicates the steady-state current amplitudes fitted with a single-exponential function (0 mV, 3 s) applied at −80 mV. B, lidocaine (left) and bupivacaine (right) decreased the proton currents in a dose-dependent manner. C, extracellular application of 10 mm QX-314 had no effect on the proton currents. pHo/pHi= 7.3/5.5.
Figure 2
Figure 2. Effects of lidocaine and bupivacaine on the proton currents at different potentials
A, proton currents were evoked by depolarizing pulses in 20 mV increments applied at the holding potential of −80 mV in the absence (a) and presence of 3 mm lidocaine (b). Following the depolarizing potentials, tail currents were recorded at 0 mV. B, dose–response curves for lidocaine (filled symbols) and bupivacaine-induced changes (open symbols) of the amplitudes of steady-state currents measured at 0, 20 and 40 mV. The data are expressed as percentages of the control values (n = 4–8). Curves were fitted to the Hill equation. The IC50 values for lidocaine were 1.2 (0 mV), 1.5 (20 mV) and 1.9 mm (at 40 mV). The IC50 values for bupivacaine were 0.51 (0 mV), 0.58 (20 mV) and 0.63 mm (40 mV). pHo/pHi= 7.3/5.5. C, the averaged activation time constants (τact) at 0 mV, expressed as a percentage of the control value, were plotted against the concentrations: for lidocaine (filled circles), 130 ± 16 (0.3 mm), 170 ± 23 (1 mm) and 340 ± 86% (3 mm; n = 5); and for bupivacaine (open circles), 120 ± 10 (0.1 mm), 140 ± 15 (0.3 mm), 210 ± 37 (1 mm) and 370 ± 44% (3 mm; n = 5). Data are compared between lidocaine and bupivacaine at the same concentration. *P < 0.05. D, voltage dependence of the steady-state proton currents. Relative tail currents, normalized by the maximal values, were plotted against prepotentials (n = 5–7). Curves are fits by the Boltzmann equation. Lidocaine shifted the activation curve to more positive voltages in a dose-dependent manner. Half-activation voltages (V0.5) were −20.1 (control), −13.1 (0.3 mm), −8.1 (1 mm) and 2.5 mV (3 mm). Data are means ± SD.
Figure 3
Figure 3. Effects of pHo and pHi on the lidocaine-induced inhibition of the proton currents
A, effects of the neutral (pHo= 7.0, left) and alkaline external solutions (pHo= 8.0, right) on the 3 mm lidocaine-induced inhibition of proton currents activated by depolarization pulses (0 mV) applied at −80 mV. The external solutions with and without lidocaine were applied using the U-tube method. B, steady-state currents in the presence of lidocaine (3 mm) at pHo 7.0, 7.3 or 8.0 in the same cells are expressed as a percentage of the control values (n = 3). C, 10 mm lidocaine-induced inhibition of the proton currents at pHi 5.5, 6.5 and 7.3. The pHo was constant (7.3). The currents were evoked by depolarization pulses (0 mV for pHi 5.5 and 100 mV for pHi 6.5 and 7.3). The holding potentials were −80 mV for pHi 5.5 and −60 mV for pHi 6.5 and 7.3. D, steady-state currents in the presence of lidocaine (10 mm) at pHi 5.5 (9 ± 7%, n = 4), pHi 6.5 (56 ± 15%, n = 4) and pHi 7.3 (71 ± 10%, n = 3). Data are means ± SD. *P < 0.05. **P < 0.01. ***P < 0.001.
Figure 4
Figure 4. The shifts of the reversal potentials (ΔVrev) induced by lidocaine
A, the relationship between Vrev and pHi in the absence of local anaesthetics. The Vrev values were estimated from the I–V relationships obtained by the repolarization-pulse method. The continuous line shows the linear regression curve for the mean values (n = 7–26), with a slope of 52.3 mV (pH unit)-1, which was close to the Nernst equation (dashed line). The pHo was 7.3. B, the I–V relationships obtained from the repolarization ramp pulses applied at the end of depolarizations in a cell, in control conditions (filled symbols) and after addition of 3 mm lidocaine (open symbols). The values of Vrev are indicated by arrows. C, ΔVrev induced by lidocaine (filled columns), bupivacaine (open columns) and QX-314 (arrow). The right ordinate represents pHi increases estimated from ΔVrev (n = 4–7). D, the relationships between the inhibition (%) of proton currents and ΔVrev. The inhibition correlated well with the ΔVrev. The continuous line is the linear regression for the mean values (correlation coefficient, r2 > 0.95). E, lidocaine (1, 3 and 10 mm) was applied on the steady-state currents for 5 s using the U-tube system. The I–V curves were obtained immediately before (arrow 1, filled circles) and 4 s after the addition of lidocaine (arrow 2, open circles). F, ΔVrev, obtained from the difference between the Vrev at arrow 1 and arrow 2 (Vrev2Vrev1) for control conditions (left column) and in the presence of 3 mm lidocaine (middle column; n = 7). The right column represents the data obtained using the bath application method where the proton currents were exposed to lidocaine for >3 min (n = 8). Data are means ± SD. *P < 0.05. pHo/pHi= 7.3/5.5.
Figure 5
Figure 5. The effects of simultaneous application of lidocaine and butyrate
A, compared with the control current in standard external solution (a), the external application of lidocaine (2 mm) decreased the proton current (c). The external solution containing butyrate (110 mm) as an alternative for aspartate increased the current (d). When butyrate and lidocaine were applied together, the current remained unchanged (b). B, current normalized to the value of control (top panel) and relevant Vrev in each condition (bottom panel) are plotted. Butyrate solution containing lidocaine affected neither Vrev nor proton currents. Data are means ± SD (n = 4 for each). *P < 0.05, **P < 0.01 compared with control; and #P < 0.05, ##P < 0.01 compared with lidocaine + butyrate. pHo/pHi= 6.8/6.0.
Figure 6
Figure 6. The effects of intracellular buffer on the lidocaine-induced inhibition of the proton currents
A, lidocaine-induced ΔVrev at 20 mm Mes, a pH buffer, in the pipette (open columns), was compared with that at 120 mm Mes (filled columns). At 20 mm, ΔVrev values were 19 ± 3 (0.3 mm), 30 ± 5 (1 mm) and 45 ± 6 mV (3 mm; n = 4), which were significantly larger than those at 120 mm. B, relative current amplitudes in the presence of lidocaine at 20 and 120 mm Mes. The steady-state current amplitudes at depolarization pulse (40 mV) were normalized by the value of each control. Relative current: at 120 mm, 82 ± 9 (0.3 mm), 61 ± 7 (1 mm) and 36 ± 6% (3 mm; n = 4–8); and at 20 mm 66 ± 6 (0.3 mm), 48 ± 5 (1 mm) and 26 ± 3% (3 mm; n = 4). Data are means ± SD. *P < 0.05 compared with 120 mm.
Figure 7
Figure 7. Lidocaine- and bupivacaine-induced changes in pHi in non-clamped cells
A, the averaged time courses of the changes in pHi measured using BCECF (n = 28). Cell acidosis was generated by washout of preloaded NH4Cl (40 mm) by the Na+-free, NMDG-containing solutions. B, the lidocaine- and bupivacaine-induced increases in pHi measured with BCECF. The increases in pHi in non-clamped cells: for lidocaine, 0.45 ± 0.07 (3 mm) and 1.23 ± 0.17 (10 mm, n = 25); and for bupivacaine, 0.47 ± 0.07 (3 mm). Data are means ± SEM.
Figure 8
Figure 8. Effects of lidocaine and bupivacaine on production of reactive oxygen species (ROS)
A, representative time courses of ROS production measured by chemilluminescence in the absence and presence of lidocaine. Lidocaine suppressed the ROS production in a dose-dependent manner. B, the peak values of chemilluminescence in the absence and presence of lidocaine or bupivacaine were expressed as relative light units per second (RLU s−1) Data are means ± SD (n = 5 for each). *P < 0.05 comparing lidocaine with bupivacaine. C and D, 200 nm PMA-induced changes in the absence (C; n = 14–18) and presence of 10 mm lidocaine (D; n = 16–31). Open symbols represent data without PMA stimulation. The initial increase in pHi induced by lidocaine decayed slightly both in the absence and presence of PMA. E, the lidocaine- and bupivacaine-induced peak increases in pHi (n = 14–31). F, the effects of lidocaine on PMA-induced changes in pHi. The pHi was measured immediately before and 8 min after the addition of PMA in each cell. The pHi changes during 8 min were averaged (n = 14–31). In the presence of lidociane, PMA was added at the initial rise in pHi. Open symbols represent the data in the absence of PMA. Data are means ± SEM. *P < 0.05. In C–F, pHi was measured with BCECF in the same conditions as those in A and B.
Figure 9
Figure 9. Weak base mechanisms underlying pHi increases by local anaesthetics
A, an example of the distribution of charged and uncharged base forms of lidocaine across the plasma membrane. Intracellular concentrations of each form are calculated according to the pKa and pHo/pHi. In the case where 3 mm lidocaine is applied extracellularly at pHo 7.3, the uncharged form of intracellular and extracellular lidocaine is equilibrated at 0.5 mm. If pHi increases by ∼0.5 (from 5.5 to 6.0), the total intracellular concentration of lidocaine is estimated to be ∼50.5 mm. B, the lidocaine (closed circles)- and bupivacaine (open circles)-induced increases in pHi obtained from patch-clamp recordings (pHo/pHi 7.3/5.5) are plotted against the intracellular concentrations estimated as shown in A (n = 4–7). The pHi was calculated from the Vrev values. *P < 0.05 compared between lidocaine and bupivacaine at the same extracellular concentration. C, titration curves of the pipette solution (pH 5.5) with lidocaine (filled sqaures) and NaOH (open squares; n = 3 for each). These titration curves almost overlapped with the plot estimated from the patch-clamp studies (filled circles; the same data as shown in B). Data are means ± SD.

Similar articles

Cited by

References

    1. Arakawa K, Takahashi H, Nakagawa S, Ogawa S. The effects of lidocaine on superoxide production and p47 Phox translocation in opsonized zymosan-activated neutrophils. Anesth Analg. 2001;93:1501–1506. - PubMed
    1. Cullen BF, Haschke RH. Local anesthetic inhibition of phagocytosis and metabolism of human leukocytes. Anesthesiology. 1974;40:142–146. - PubMed
    1. DeCoursey TE. Voltage-gated proton channels and other proton transfer pathways. Physiol Rev. 2003;83:475–579. - PubMed
    1. Eder C, DeCoursey TE. Voltage-gated proton channels in microglia. Prog Neurobiol. 2001;64:277–305. - PubMed
    1. Eder C, Fischer HG, Hadding U, Heinemann U. Properties of voltage-gated currents of microglia developed using macrophage colony-stimulating factor. Pflugers Arch. 1995;430:526–533. - PubMed

Publication types