

Concentration-dependent transitions govern the subcellular localization of islet amyloid polypeptide
- PMID: 22183778
- PMCID: PMC3289502
- DOI: 10.1096/fj.11-194613
Concentration-dependent transitions govern the subcellular localization of islet amyloid polypeptide
Abstract
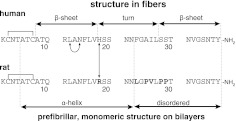
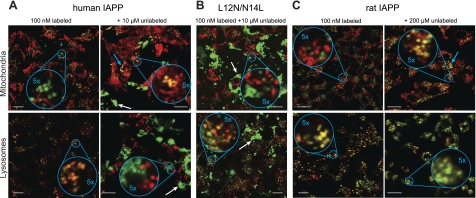
Islet amyloid polypeptide (IAPP) is a peptide hormone cosecreted with insulin by pancreatic β-cells. In type II diabetes, IAPP aggregates in a process that is associated with β-cell dysfunction and loss of β-cell mass. The relationship between IAPP's conformational landscape and its capacity to mediate cell death remains poorly understood. We have addressed these unknowns by comparing the cytotoxic effects of sequence variants with differing α-helical and amyloid propensities. IAPP was previously shown to oligomerize cooperatively on binding to lipid bilayers. Here, comparable transitions are evident in cell culture and are associated with a change in subcellular localization to the mitochondria under toxic conditions. Notably, we find that this toxic gain of function maps to IAPP's capacity to adopt aggregated membrane-bound α-helical, and not β-sheet, states. Our findings suggest that upon α-helical mediated oligomerization, IAPP acquires cell-penetrating peptide (CPP) properties, facilitating access to the mitochondrial compartment, resulting in its dysfunction.
Figures
Similar articles
-
Evidence for proteotoxicity in beta cells in type 2 diabetes: toxic islet amyloid polypeptide oligomers form intracellularly in the secretory pathway.Am J Pathol. 2010 Feb;176(2):861-9. doi: 10.2353/ajpath.2010.090532. Epub 2009 Dec 30. Am J Pathol. 2010. PMID: 20042670 Free PMC article.
-
Identification of a hinge residue controlling islet amyloid polypeptide self-assembly and cytotoxicity.J Biol Chem. 2019 May 24;294(21):8452-8463. doi: 10.1074/jbc.RA118.006454. Epub 2019 Apr 11. J Biol Chem. 2019. PMID: 30975901 Free PMC article.
-
Islet amyloid-induced cell death and bilayer integrity loss share a molecular origin targetable with oligopyridylamide-based α-helical mimetics.Chem Biol. 2015 Mar 19;22(3):369-78. doi: 10.1016/j.chembiol.2015.01.006. Epub 2015 Mar 5. Chem Biol. 2015. PMID: 25754474 Free PMC article.
-
Causative factors for formation of toxic islet amyloid polypeptide oligomer in type 2 diabetes mellitus.Clin Interv Aging. 2015 Nov 19;10:1873-9. doi: 10.2147/CIA.S95297. eCollection 2015. Clin Interv Aging. 2015. PMID: 26604727 Free PMC article. Review.
-
Aggregation of islet amyloid polypeptide: from physical chemistry to cell biology.Curr Opin Struct Biol. 2013 Feb;23(1):82-9. doi: 10.1016/j.sbi.2012.11.003. Epub 2012 Dec 22. Curr Opin Struct Biol. 2013. PMID: 23266002 Free PMC article. Review.
Cited by
-
Phosphatidylethanolamine enhances amyloid fiber-dependent membrane fragmentation.Biochemistry. 2012 Oct 2;51(39):7676-84. doi: 10.1021/bi3009888. Epub 2012 Sep 21. Biochemistry. 2012. PMID: 22970795 Free PMC article.
-
Amylin alters human brain pericyte viability and NG2 expression.J Cereb Blood Flow Metab. 2017 Apr;37(4):1470-1482. doi: 10.1177/0271678X16657093. Epub 2016 Jan 1. J Cereb Blood Flow Metab. 2017. PMID: 27354094 Free PMC article.
-
A foldamer approach to targeting membrane bound helical states of islet amyloid polypeptide.Chem Commun (Camb). 2013 May 25;49(42):4749-51. doi: 10.1039/c3cc41452c. Chem Commun (Camb). 2013. PMID: 23579860 Free PMC article.
-
Supercritical CO2 Processing Generates Aqueous Cisplatin Solutions with Enhanced Cancer Specificity.ACS Omega. 2020 Feb 24;5(9):4558-4567. doi: 10.1021/acsomega.9b03917. eCollection 2020 Mar 10. ACS Omega. 2020. PMID: 32175502 Free PMC article.
-
Small molecule screening in context: lipid-catalyzed amyloid formation.Protein Sci. 2014 Oct;23(10):1341-8. doi: 10.1002/pro.2518. Epub 2014 Jul 28. Protein Sci. 2014. PMID: 25043951 Free PMC article.
References
-
- Hoppener J. W., Ahren B., Lips C. J. (2000) Islet amyloid and type 2 diabetes mellitus. N. Engl. J. Med. 343, 411–419 - PubMed
-
- Kahn S. E., Andrikopoulos S., Verchere C. B. (1999) Islet amyloid: a long-recognized but underappreciated pathological feature of type 2 diabetes. Diabetes 48, 241–253 - PubMed
-
- Clark A., Nilsson M. R. (2004) Islet amyloid: a complication of islet dysfunction or an aetiological factor in Type 2 diabetes? Diabetologia. 47, 157–169 - PubMed
-
- Hull R. L., Westermark G. T., Westermark P., Kahn S. E. (2004) Islet amyloid: a critical entity in the pathogenesis of type 2 diabetes. J. Clin. Endocrinol. Metab. 89, 3629–3643 - PubMed
Publication types
MeSH terms
Substances
Grants and funding
LinkOut - more resources
Full Text Sources
Other Literature Sources
