

Melanocortin receptors in rat liver cells: change of gene expression and intracellular localization during acute-phase response
- PMID: 22183812
- PMCID: PMC3312751
- DOI: 10.1007/s00418-011-0899-7
Melanocortin receptors in rat liver cells: change of gene expression and intracellular localization during acute-phase response
Abstract
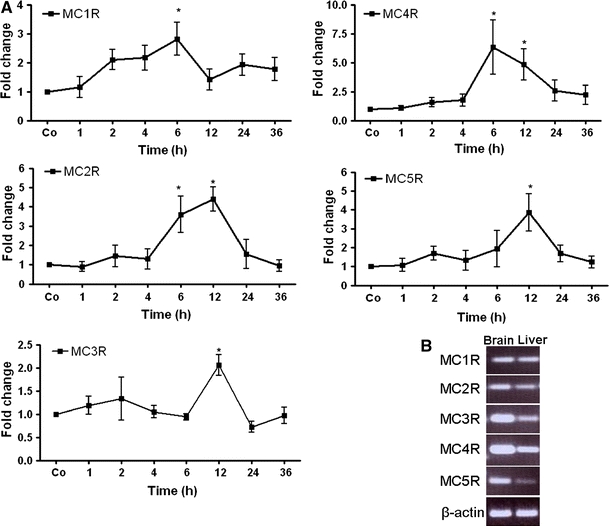
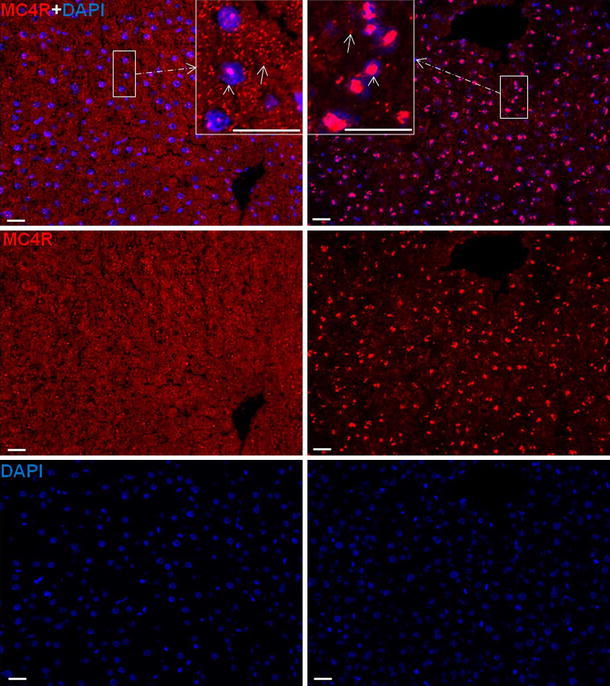
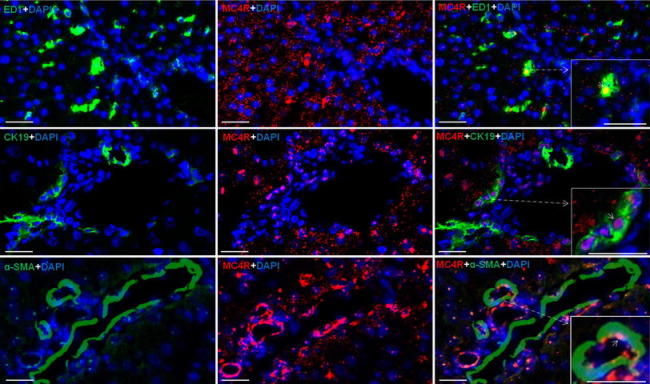
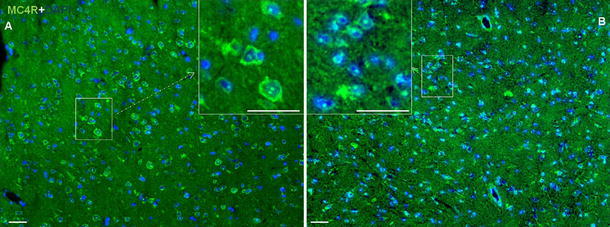
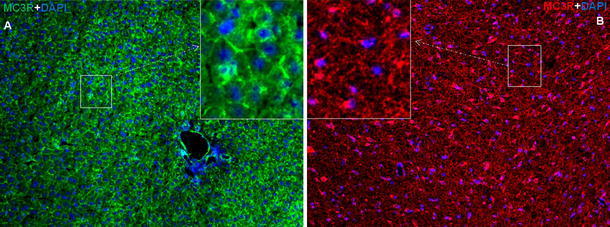
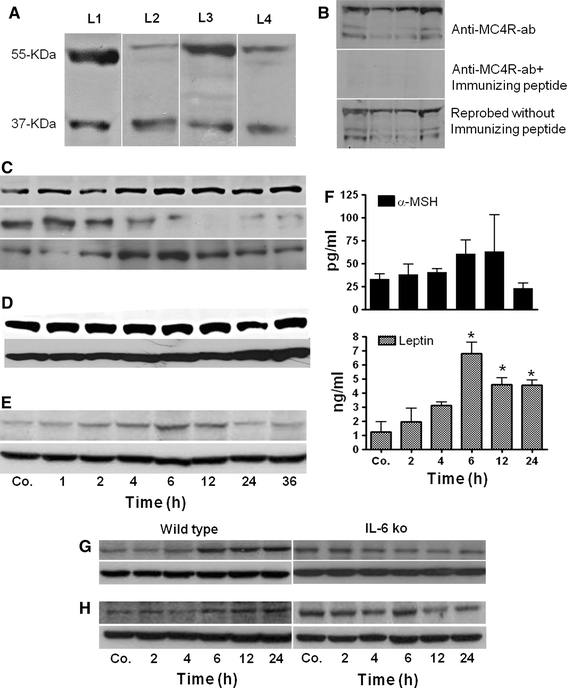
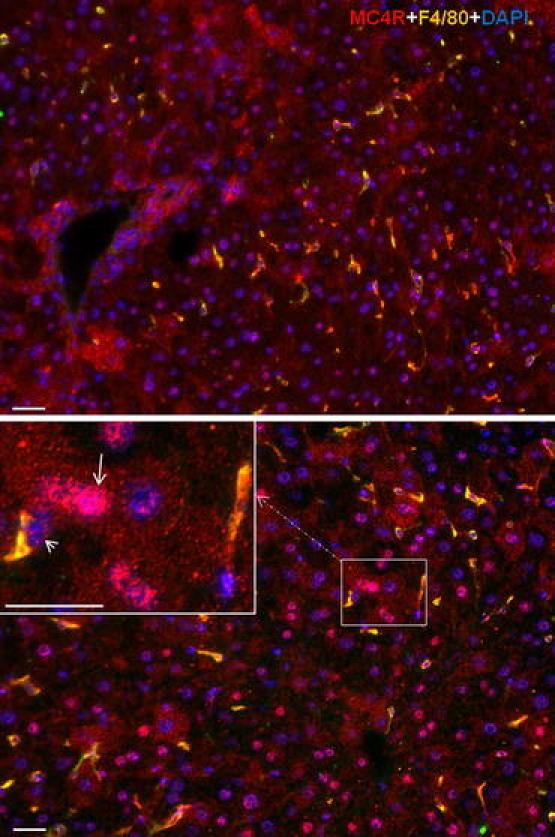
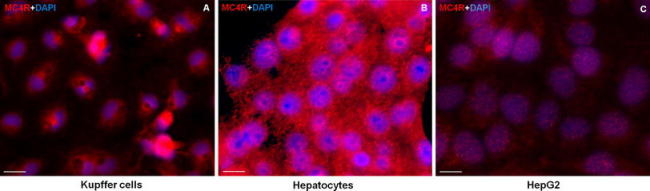
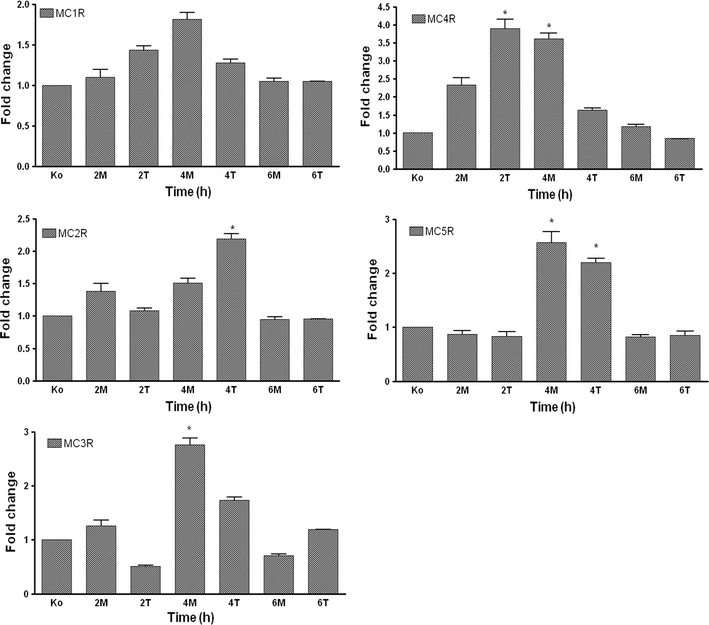
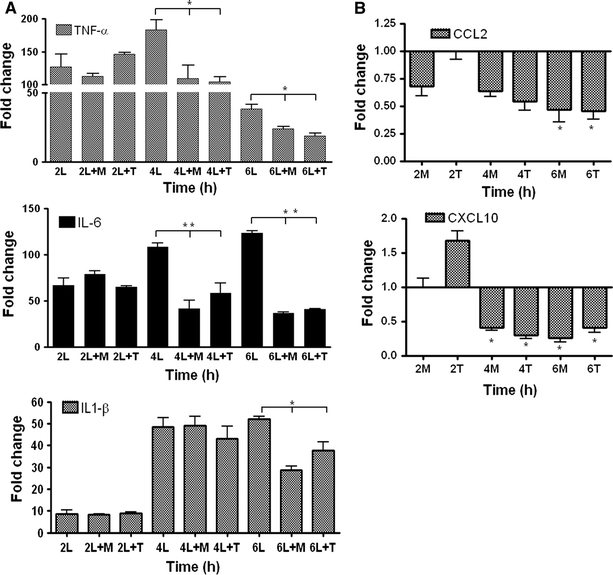
MCRs are known to be expressed predominantly in the brain where they mediate metabolic and anti-inflammatory functions. Leptin plays an important role in appetite and energy regulation via signaling through melanocortin receptors (MCRs) in the brain. As serum levels of MCR ligands are elevated in a clinical situation [acute-phase response (APR)] to tissue damage, where the liver is responsible for the metabolic changes, we studied hepatic gene expression of MCRs in a model of muscle tissue damage induced by turpentine oil (TO) injection in rats. A significant increase in gene expression of all five MCRs (MC4R was the highest) in liver at the RNA and protein level was detected after TO injection. A similar pattern of increase was also found in the brain. Immunohistology showed MC4R in the cytoplasm, but also in the nucleus of parenchymal and non-parenchymal liver cells, whereas MC3R-positivity was mainly cytoplasmic. A time-dependent migration of MC4R protein from the cytoplasm into the nucleus was observed during APR, in parallel with an increase in α-MSH and leptin serum levels. An increase of MC4R was detected at the protein level in wild-type mice, while such an increase was not observed in IL-6ko mice during APR. Moreover, treatment of isolated liver cells with melanocortin agonists (α-MSH and THIQ) inhibited the endotoxin-induced upregulation of the acute-phase cytokine (IL-6, IL1β and TNF-α) gene expression in Kupffer cells and of chemokine gene expression in hepatocytes. MCRs are expressed not only in the brain, but also in liver cells and their gene expression in liver and brain tissue is upregulated during APR. Due to the presence of specific ligands in the serum, they may mediate metabolic changes and exert a protective effect on liver cells.
Figures
Similar articles
-
Analysis of the therapeutic functions of novel melanocortin receptor agonists in MC3R- and MC4R-deficient C57BL/6J mice.Peptides. 2009 Oct;30(10):1892-900. doi: 10.1016/j.peptides.2009.07.012. Epub 2009 Jul 29. Peptides. 2009. PMID: 19646498 Free PMC article.
-
Melanocortin 2, 3 and 4 Receptor Gene Expressions are Downregulated in CD8+ T Cytotoxic Lymphocytes and CD19+ B Lymphocytes in Rheumatoid Arthritis Responding to TNF-α Inhibition.Scand J Immunol. 2017 Jul;86(1):31-39. doi: 10.1111/sji.12555. Scand J Immunol. 2017. PMID: 28426141
-
Biphasic effect of melanocortin agonists on metabolic rate and body temperature.Cell Metab. 2014 Aug 5;20(2):333-45. doi: 10.1016/j.cmet.2014.05.021. Epub 2014 Jun 26. Cell Metab. 2014. PMID: 24981835 Free PMC article.
-
60 YEARS OF POMC: Melanocortin receptors: evolution of ligand selectivity for melanocortin peptides.J Mol Endocrinol. 2016 May;56(4):T119-33. doi: 10.1530/JME-15-0292. Epub 2016 Jan 20. J Mol Endocrinol. 2016. PMID: 26792827 Review.
-
The melanocortin receptors: lessons from knockout models.Neuropeptides. 2002 Apr-Jun;36(2-3):77-84. doi: 10.1054/npep.2002.0890. Neuropeptides. 2002. PMID: 12359499 Review.
Cited by
-
Evaluation of hypothalamic murine and human melanocortin 3 receptor transcript structure.Biochem Biophys Res Commun. 2014 Nov 7;454(1):234-8. doi: 10.1016/j.bbrc.2014.10.072. Epub 2014 Oct 22. Biochem Biophys Res Commun. 2014. PMID: 25450386 Free PMC article.
-
Melanocortin 1 receptor regulates cholesterol and bile acid metabolism in the liver.Elife. 2023 Jul 25;12:e84782. doi: 10.7554/eLife.84782. Elife. 2023. PMID: 37490042 Free PMC article.
-
Differential expression of the melanocortin-4 receptor in male and female C57BL/6J mice.Mol Biol Rep. 2014 May;41(5):3245-56. doi: 10.1007/s11033-014-3187-5. Epub 2014 Feb 1. Mol Biol Rep. 2014. PMID: 24488261
-
αMSH blunts endotoxin-induced MuRF1 and atrogin-1 upregulation in skeletal muscle by modulating NF-κB and Akt/FoxO1 pathway.Mediators Inflamm. 2014;2014:179368. doi: 10.1155/2014/179368. Epub 2014 Sep 9. Mediators Inflamm. 2014. PMID: 25294954 Free PMC article.
-
Activation of melanocortin receptor 4 with RO27-3225 attenuates neuroinflammation through AMPK/JNK/p38 MAPK pathway after intracerebral hemorrhage in mice.J Neuroinflammation. 2018 Apr 11;15(1):106. doi: 10.1186/s12974-018-1140-6. J Neuroinflammation. 2018. PMID: 29642894 Free PMC article.
References
-
- Biebermann H, Krude H, Elsner A, Chubanov V, Gudermann T, Gruters A. Autosomal-dominant mode of inheritance of a melanocortin-4 receptor mutation in a patient with severe early-onset obesity is due to a dominant-negative effect caused by receptor dimerization. Diabetes. 2003;52:2984–2988. doi: 10.2337/diabetes.52.12.2984. - DOI - PubMed
-
- Bitto A, Polito F, Altavilla D, Irrera N, Giuliani D, Ottani A, Minutoli L, Spaccapelo L, Galantucci M, Lodi R, Guzzo G, Guarini S, Squadrito F. Melanocortins protect against multiple organ dysfunction syndrome in mice. Br J Pharmacol. 2011;162:917–928. doi: 10.1111/j.1476-5381.2010.01098.x. - DOI - PMC - PubMed
-
- Caruso C, Durand D, Schioth HB, Rey R, Seilicovich A, Lasaga M. Activation of melanocortin 4 receptors reduces the inflammatory response and prevents apoptosis induced by lipopolysaccharide and interferon-gamma in astrocytes. Endocrinology. 2007;148:4918–4926. doi: 10.1210/en.2007-0366. - DOI - PubMed
MeSH terms
Substances
LinkOut - more resources
Full Text Sources
Molecular Biology Databases
Research Materials
Miscellaneous
