Review
. 2012 Jun;22(6):736-56.
doi: 10.1093/glycob/cwr182. Epub 2011 Dec 18.

Control of mucin-type O-glycosylation: a classification of the polypeptide GalNAc-transferase gene family

Affiliations
Review

Control of mucin-type O-glycosylation: a classification of the polypeptide GalNAc-transferase gene family

Eric P Bennett et al. Glycobiology. 2012 Jun.

Abstract

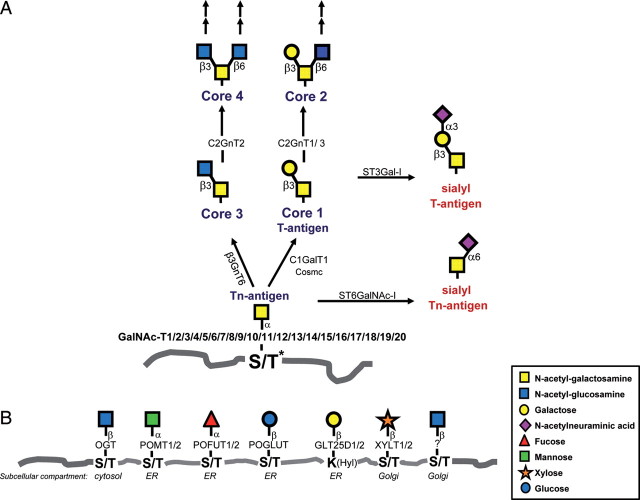
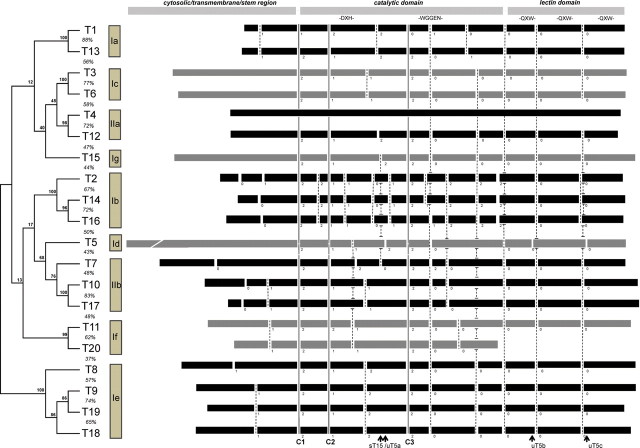
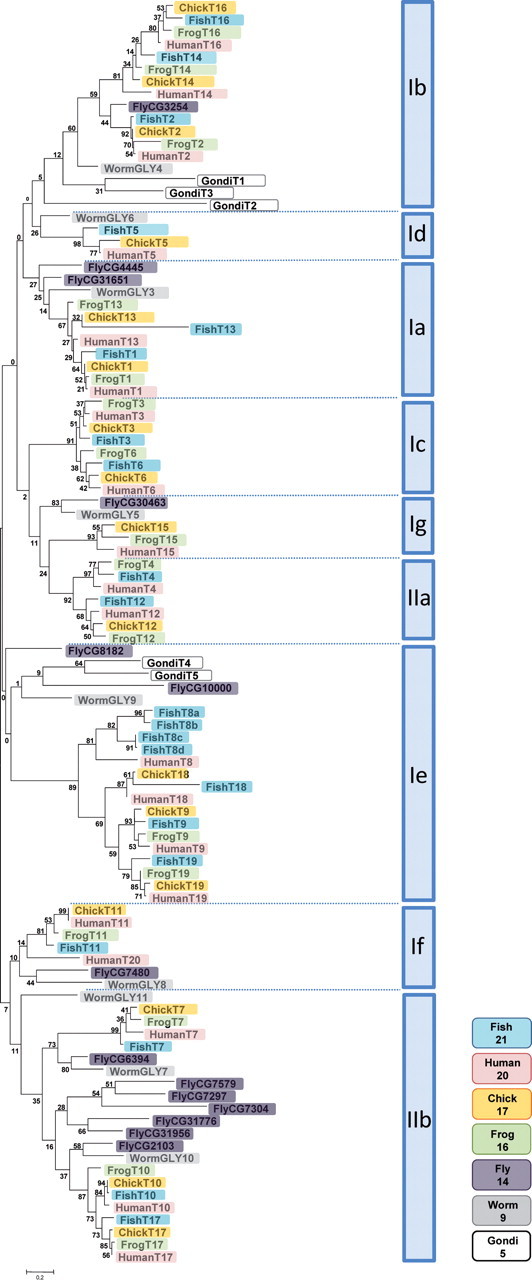
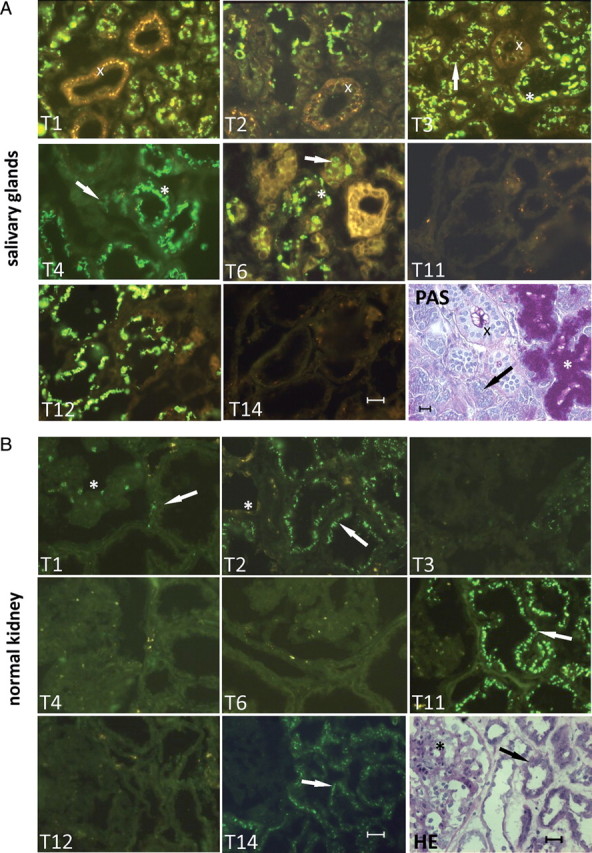
Glycosylation of proteins is an essential process in all eukaryotes and a great diversity in types of protein glycosylation exists in animals, plants and microorganisms. Mucin-type O-glycosylation, consisting of glycans attached via O-linked N-acetylgalactosamine (GalNAc) to serine and threonine residues, is one of the most abundant forms of protein glycosylation in animals. Although most protein glycosylation is controlled by one or two genes encoding the enzymes responsible for the initiation of glycosylation, i.e. the step where the first glycan is attached to the relevant amino acid residue in the protein, mucin-type O-glycosylation is controlled by a large family of up to 20 homologous genes encoding UDP-GalNAc:polypeptide GalNAc-transferases (GalNAc-Ts) (EC 2.4.1.41). Therefore, mucin-type O-glycosylation has the greatest potential for differential regulation in cells and tissues. The GalNAc-T family is the largest glycosyltransferase enzyme family covering a single known glycosidic linkage and it is highly conserved throughout animal evolution, although absent in bacteria, yeast and plants. Emerging studies have shown that the large number of genes (GALNTs) in the GalNAc-T family do not provide full functional redundancy and single GalNAc-T genes have been shown to be important in both animals and human. Here, we present an overview of the GalNAc-T gene family in animals and propose a classification of the genes into subfamilies, which appear to be conserved in evolution structurally as well as functionally.


Figures

Fig. 1.
Fig. 1.
Mammalian protein O-glycosylation pathways. (A) The common mucin-type O-glycosylation core 1–4 biosynthetic pathways. Mucin-type O-glycosylation is initiated by up to 20 GalNAc-Ts forming the Tn structure, which may be elongated by the core 1 synthase, C1Gal-T1, or the core 3 synthase, β3GnT6, and further branched by the core 2 synthases, C2GnT1-3. C1Gal-T1 function is dependent on the presence of the chaperone COSMC. The different core structures can be further elongated and branched by N-acetyllactosamine chains and/or terminated by blood group ABH-related structures, fucose and sialic acids. Sialylation may terminate chain elongation and branching as indicated by the action of ST3Gal-I on core 1, which produces the ST structure. Premature sialylation of the first GalNAc by ST6GalNAc-I leads to the cancer-associated structure STn. (Asterisk) Recent studies demonstrate that GalNAc may also be bound to Tyr (Halim et al. 2011; Steentoft et al. 2011). (B) Other known types of protein O-glycosylation in mammals and the initiating enzymes. These types include O-GlcNAc found on nuclear and cytoplasmic proteins, O-mannose found on α-dystroglycan, O-fucose and O-glucose found on EGF domains in membrane proteins, O-Gal linked to 5-Hyls found on collagens, O-xylose found on proteoglycans and recently identified O-GlcNAc found on extracellular proteins (Matsuura et al. 2008; Sakaidani et al. 2010). Glycosyltransferases involved in the formation of the structures depicted are indicated by their official name, and the subcellular compartments where these modifications are initiated are indicated.
Fig. 2.
Fig. 2.
Phylogenetic and genomic analysis of the human GalNAc-T gene family. Left panel shows the unrooted tree derived from molecular phylogenetic anaylsis by the maximum likelihood method of Gblock (Talavera and Castresana 2007) curated ClustalW (http://www.ebi.ac.uk/FTP/) alignments. Evolutionary analyses were conducted in MEGA5 (Tamura et al. 2011). In brief, the evolutionary history was inferred by the use of the maximum likelihood method based on the Dayhoff w/freq. model. The bootstrap consensus tree inferred from 1000 replicates is taken to represent the evolutionary history of the taxa analyzed. The percentage of replicate trees in which the associated taxa clustered together in the bootstrap test (1000 replicates) are shown next to the branches. The tree is drawn to scale, with branch lengths measured in the number of substitutions per site. There were a total of 206 positions in the final data set. The unrooted tree is based on amino acid analysis of the catalytic domain of all 20 human GalNAc-Ts. The catalytic domains were defined as previously described (Schwientek et al. 2002) using the accession numbers listed in Table I. The amino acid identities of the catalytic domains (%) are indicated between isoforms. The robustness of the predicted Ig phylogenetic branch was additionally confirmed by the analysis of separate trees generated for Ig (GalNAc-T15) with either subfamily I or II members (grouping Ig with, respectively, Ic or IIa with high bootstrapping confidence, data not shown). Right panel depicts genomic organization of the ORF for all 20 human GALNT genes. Intron positions are based on the gene alignments shown in Supplementary data, Figure S1. Exons are shown as boxes and isoforms grouped in the cladogram are shaded intermittently in grey and black. For GALNT5, the first exon encoding an extended stem region of ∼500 amino acids has been truncated as indicated by a break. Conserved intron/exon boundaries (boundaries shared among all genes except for GALNT4) are indicated by a solid line and labeled C1–C3 at the bottom. Intron boundaries shared between two or more genes are shown by a broken line. The intron phases (0, 1, 2) are indicated by numbers below introns (phase 0 introns are positioned between two codons, phase 1 introns after the first base of the codon and phase 2 introns are positioned after the second base of the codon). The position of the diagnostic introns unique for T5 (uT5a, b and c) and T15 (sT15) is indicated with arrows at their relative positions below. Based on the cladogram and similarities in genomic organizations we propose a classification of the GalNAc-Ts into seven subfamilies designated Ia–g and IIa and b. Members of subfamily I contain GalNAc-T isoforms that predominantly display peptide substrate specificity, and members of subfamily II contain GalNAc-T isoforms that predominantly display GalNAc-glycopeptide substrate specificity. The regions encoding the different domains of GalNAc-Ts (cytosolic/transmembrane/stem regions, catalytic and lectin domains) including positions of identified functional motifs are shown on the top.
Fig. 3.
Fig. 3.
Phylogenetic tree of 102 GalNAc-Ts from human (Homo sapiens), frog (X. tropicalis), chicken (G. gallus), fish (D. rerio), fly (D. melanogaster), worm (C. elegans) and Gondi (T. gondii). The following Genbank accession numbers were used in addition to those of Table I. GALNT1: X. tropicalis NP_001025547.1, D. rerio XP_687472.2, D. melanogaster NP_001036338.1 (CG31651), G. gallus NP_001006381.1, C. elegans NP_498722.1 (gly-3). GALNT2: X. tropicalis XP_002931524.1, D. melanogaster NP_608773.2 (CG3254), G. gallus XP_419581.2, C. elegans NP_507850.2 (gly-4). GALNT3: X. tropicalis XP_002936794.1, D. rerio XM_003199248, D. melanogaster NP_725603.2 CG30463, G. gallus XP_422023.2. GALNT4: X. tropicalis NP_001072705.1, D. rerio NP_001038243.2, D. melanogaster NP_725603.2 (CG30463), C. elegans NP_001022851.1 (gly-5). GALNT5: D. rerio XP_001338929.2, G. gallus XP_422169.2. GALNT6: X. tropicalis XP_002933739.1, D. rerio NP_998361.1, G. gallus NP_001026749.1. GALNT7: X. tropicalis NP_001001200.1, D. rerio NP_001018477.1 and NP_573301.2 (CG6394), G. gallus XP_420521.2, C. elegans NP_503512.1 (gly-7). GALNT8: D. rerio XM_691878.2 (GALNT8a), XM_691987.2 (GALNT8b), XM_003198224.1 (GALNT8c), XM_003198223.1 (GALNT8d). GALNT9: X. tropicalis XP_002931923.1, D. rerio XP_001338018.1, G. gallus XP_415088.2. GALNT10: X. tropicalis NP_001072444.1, D. rerio NM_001076604.1, G. gallus XP_420520.2. GALNT11: X. tropicalis NP_001006904.1, D. rerio NP_001070030.1, D. melanogaster NP_652069.2, G. gallus XM_418541.2. GALNT12: X. tropicalis XM_002935135, D. rerio XP_688194.1, G. gallus XM_419065.2. GALNT13: X. tropicalis NP_001017277.1, D. rerio XM_002663311.2, D. melanogaster NM_136412 (CG4445), C. elegans NP_001022646.1 (gly-6), G. gallus XP_422165.2. GALNT14: X. tropicalis NP_001072369, D. rerio NP_001038460.1, G. gallus XM_419370.2. GALNT15: X. tropicalis XP_002932836.1, G. gallus XP_418741.2, D. melanogaster NP_648800 (CG7297), NP_996098 (CG7304), AAN10370.1 (CG31956), AAF51101.3 (CG31776), AF326979_1 (CG7579) and AAF56810.2 (CG10000). GALNT16: X. tropicalis NP_001039091.1, D. rerio XP_001339749.3, G. gallus XP_001231965.1. GALNT17: X. tropicalis XP_002933366.1, D. rerio NP_001139074.1, D. melanogaster NP_647749.2 (CG2103), C. elegans NP_001041037.1 (gly-10). GALNT18: D. rerio XP_689577.2, G. gallus XP_420966.2. GALNT19: X. tropicalis XP_002935847.1, D. rerio XP_696189.3, G. gallus XP_415728.2. GALNT20: C. elegans AAC13678.1 (gly-8), AAC13679 (GLY9) and NP_001022948 (gly-11), T. gondii XP_002365147.1 (T1), XP_002365091.1 (T2), XP_002369811.1 (T3), XP_002364915.1 (T4) and XP_002370555.1 (T5). Maximum likelihood phylogenetic analysis of Gblock curated ClustalW alignments was conducted as described in Figure 2. The subfamily classification is shown to the right. The different species are color coded and the number of genes identified in each species is indicated, according to the designations shown at the lower right.
Fig. 4.
Fig. 4.
Illustration of expression patterns of eight GalNAc-T isoforms in normal (A) salivary glands, (B) kidney, (C) colon and in (D) colon adenocarcinomas evaluated by immunofluorescence histology using MAbs with well-characterized specificities. Each panel is labeled with the GalNAc-T isoform analyzed [GalNAc-T1 with MAb UH3 (4D8); GalNAc-T2 with MAb UH4 (4C4); GalNAc-T3 with MAb UH5 (2D10); GalNAc-T4 with MAb UH6 (4G2); GalNAc-T6 with MAb UH7 (2F3); GalNAc-T11 with MAb UH8 (1B2); GalNAc-T12 with MAb 1F9 (unpublished) and GalNAc-T14 with MAb 3D2 (unpublished)] (Bennett, Hassan, et al. 1998; Bennett, Hassan, Mandel, et al. 1999; Mandel et al. 1999; Schwientek et al. 2002), and the protocol used for staining fresh frozen sections was as described previously (Mandel et al. 1999). Positive FITC fluorescence is shown in green. (A) Neighboring sections were also stained with PAS, HE or MAb PMH1 to human GalNAc-glycosylated MUC2 as indicated (Reis et al. 1998). The PAS staining of salivary glands clearly marks mucous acini (indicated by asterisks), serous acini (indicated by arrows) and duct cells (indicated by crosss). (B) The HE staining of kidney marks glomeruli (indicated by asterisks) and tubules (indicated by arrows). (C and D) Staining for MUC2 in colon tissues marks goblet cells (indicated by an arrow). Colon tissues were counterstained with Dapi nuclear stain in blue. 20 μM scale bar is included in figures.
Fig. 4.
Fig. 4.
Illustration of expression patterns of eight GalNAc-T isoforms in normal (A) salivary glands, (B) kidney, (C) colon and in (D) colon adenocarcinomas evaluated by immunofluorescence histology using MAbs with well-characterized specificities. Each panel is labeled with the GalNAc-T isoform analyzed [GalNAc-T1 with MAb UH3 (4D8); GalNAc-T2 with MAb UH4 (4C4); GalNAc-T3 with MAb UH5 (2D10); GalNAc-T4 with MAb UH6 (4G2); GalNAc-T6 with MAb UH7 (2F3); GalNAc-T11 with MAb UH8 (1B2); GalNAc-T12 with MAb 1F9 (unpublished) and GalNAc-T14 with MAb 3D2 (unpublished)] (Bennett, Hassan, et al. 1998; Bennett, Hassan, Mandel, et al. 1999; Mandel et al. 1999; Schwientek et al. 2002), and the protocol used for staining fresh frozen sections was as described previously (Mandel et al. 1999). Positive FITC fluorescence is shown in green. (A) Neighboring sections were also stained with PAS, HE or MAb PMH1 to human GalNAc-glycosylated MUC2 as indicated (Reis et al. 1998). The PAS staining of salivary glands clearly marks mucous acini (indicated by asterisks), serous acini (indicated by arrows) and duct cells (indicated by crosss). (B) The HE staining of kidney marks glomeruli (indicated by asterisks) and tubules (indicated by arrows). (C and D) Staining for MUC2 in colon tissues marks goblet cells (indicated by an arrow). Colon tissues were counterstained with Dapi nuclear stain in blue. 20 μM scale bar is included in figures.

References

    1. Abi-Rached L, Gilles A, Shiina T, Pontarotti P, Inoko H. Evidence of en bloc duplication in vertebrate genomes. Nat Genet. 2002;31:100–105. - PubMed
    1. Acar M, Jafar-Nejad H, Takeuchi H, Rajan A, Ibrani D, Rana NA, Pan H, Haltiwanger RS, Bellen HJ. Rumi Is a CAP10 Domain Glycosyltransferase that Modifies Notch and Is Required for Notch Signaling. Cell. 2008;132:247–258. - PMC - PubMed
    1. Almeida R, Levery SB, Mandel U, Kresse H, Schwientek T, Bennett EP, Clausen H. Cloning and expression of a proteoglycan UDP-galactose:β-xylose β1, 4-galactosyltransferase I. A seventh member of the human β4-galactosyltransferase gene family. J Biol Chem. 1999;274:26165–26171. - PubMed
    1. Balakirev ES, Ayala FJ. Pseudogenes: Are they “junk” or functional DNA? Annu Rev Genet. 2003;37:123–151. - PubMed
    1. Bard F, Mazelin L, Pechoux-Longin C, Malhotra V, Jurdic P. Src regulates Golgi structure and KDEL receptor-dependent retrograde transport to the endoplasmic reticulum. J Biol Chem. 2003;278:46601–46606. - PubMed

Publication types