. 2012 Mar;32(5):900-12.
doi: 10.1128/MCB.06286-11. Epub 2011 Dec 19.

DNA damage signals through differentially modified E2F1 molecules to induce apoptosis

Affiliations

DNA damage signals through differentially modified E2F1 molecules to induce apoptosis

Jasmyne Carnevale et al. Mol Cell Biol. 2012 Mar.

Abstract

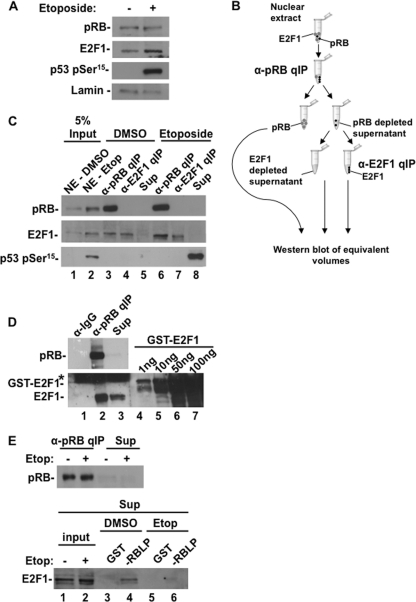
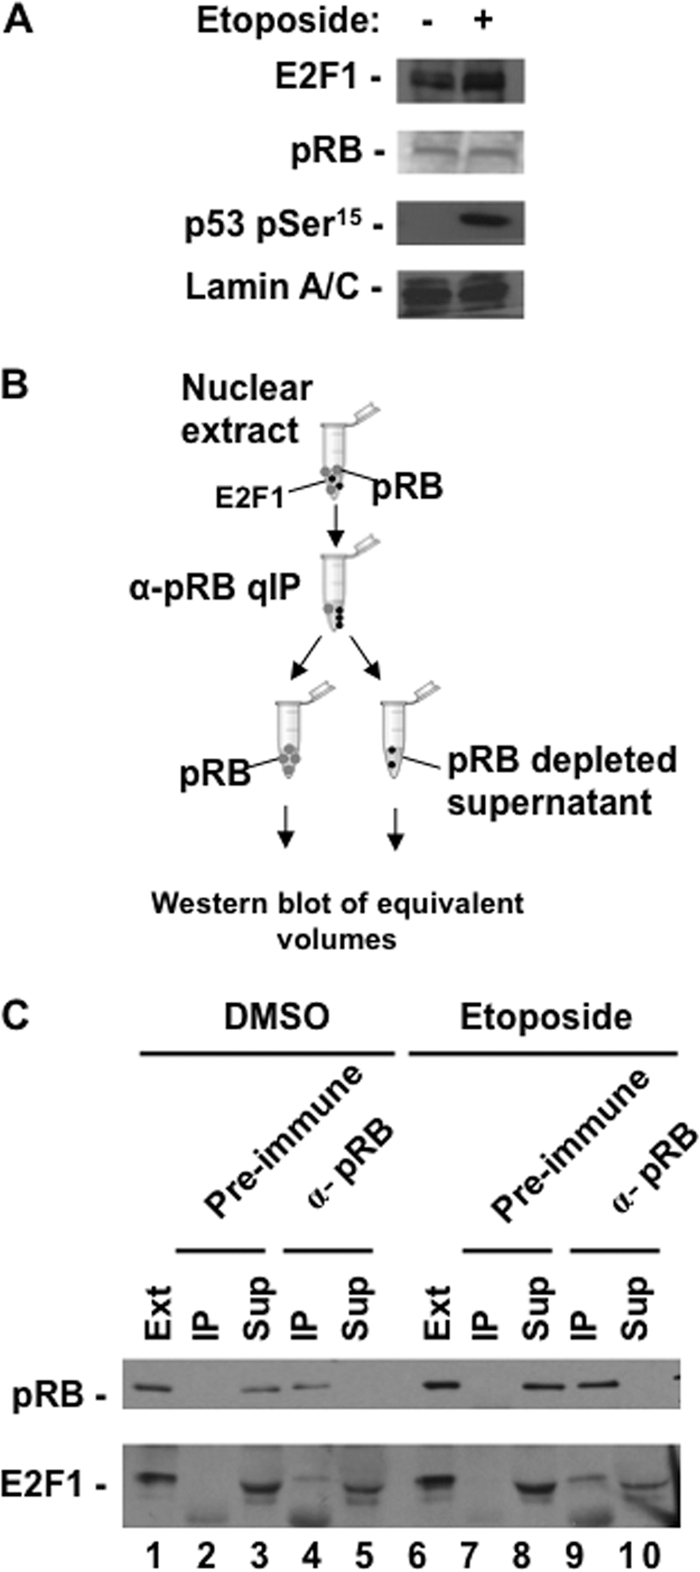
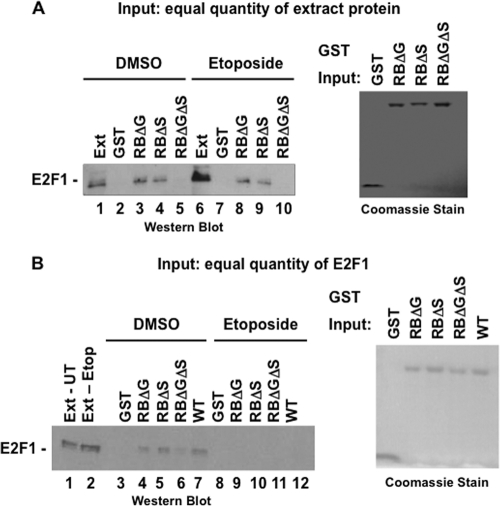
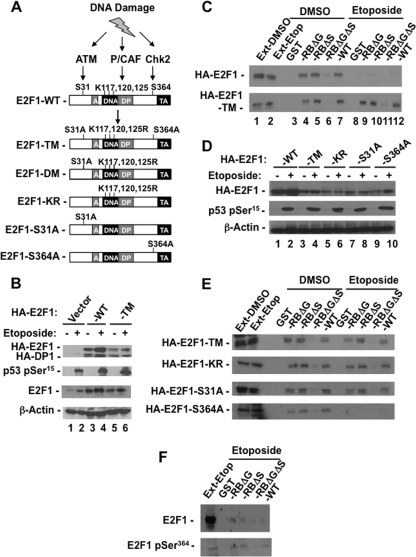
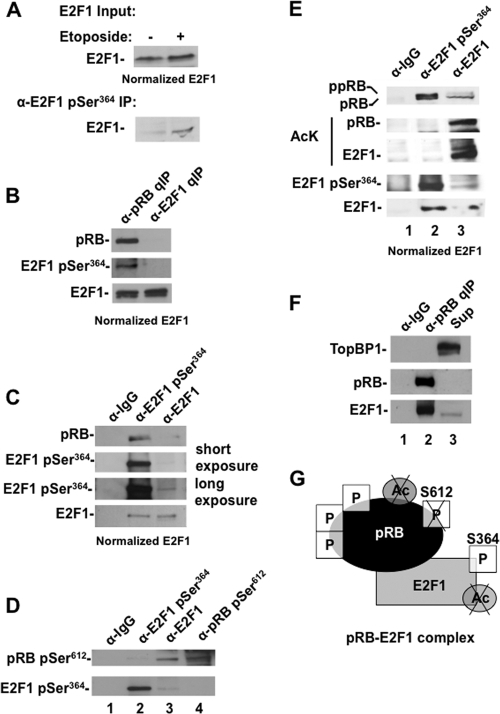
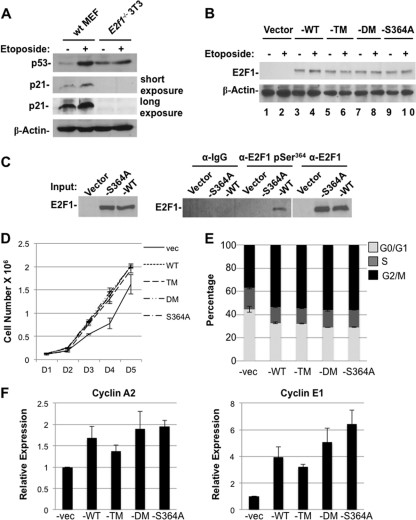
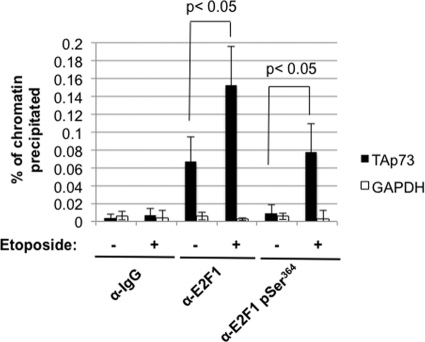
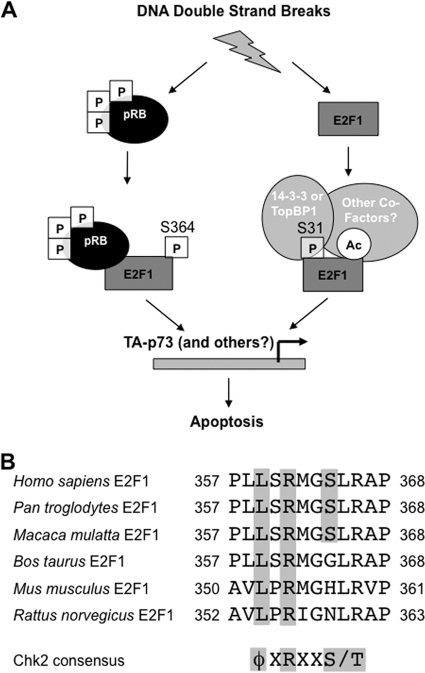
E2F transcription can lead to cell proliferation or apoptosis, indicating that E2Fs control opposing functions. In a similar manner, DNA double-strand breaks can signal to induce cell cycle arrest or apoptosis. Specifically, pRB is activated following DNA damage, allowing it to bind to E2Fs and block transcription at cell cycle promoters; however, E2F1 is simultaneously activated, leading to transcription at proapoptotic promoters. We examined this paradoxical control of E2F transcription by studying how E2F1's interaction with pRB is regulated following DNA damage. Our work reveals that DNA damage signals create multiple forms of E2F1 that contain mutually exclusive posttranslational modifications. Specifically, E2F1 phospho-serine 364 is found only in complex with pRB, while E2F1 phosphorylation at serine 31 and acetylation function to create a pRB-free form of E2F1. Both pRB-bound and pRB-free modifications on E2F1 are essential for the activation of TA-p73 and the maximal induction of apoptosis. Chromatin immunoprecipitation demonstrated that E2F1 phosphorylated on serine 364 is also present at proapoptotic gene promoters during the induction of apoptosis. This indicates that distinct populations of E2F1 are organized in response to DNA damage signaling. Surprisingly, these complexes act in parallel to activate transcription of proapoptotic genes. Our data suggest that DNA damage signals alter pRB and E2F1 to engage them in functions leading to apoptotic induction that are distinct from pRB-E2F regulation in cell cycle control.


Figures

Fig 1
Fig 1
DNA damage signaling generates two distinct populations of E2F1. (A) U2OS cells were treated with 100 μM etoposide or DMSO for 8 h. Relative expression levels of pRB, E2F1, p53 pSer15, and lamin A/C in U2OS nuclear extracts were determined by Western blotting. (B) Schematic diagram of quantitative immunoprecipitation (qIP) method. All pRB-containing complexes are first removed from nuclear extracts by immunoprecipitation, followed by all unbound E2F1, and lastly depleted supernatant is retained as a control for the quantitative nature of the IP. (C) Nuclear extracts were successively precipitated with antibodies against pRB and E2F1 as shown in panel B. Fractions were assayed for pRB, E2F1, and p53 pSer15 levels by Western blotting. (D) Quantitative immunoprecipitation fractions from the DNA-damaged nuclear extracts in panel C were analyzed by SDS-PAGE alongside a range of recombinant GST-E2F1 protein standards. E2F1 Western blot analysis was used to compare pRB-free E2F1 and pRB-E2F1 protein quantities. The asterisk indicates a nonspecific band. (E) pRB was quantitatively immunoprecipitated from untreated and etoposide-treated extracts. Fractions were Western blotted for pRB levels to ensure its depletion. Untreated and treated supernatants were normalized for pRB-free E2F1 levels and used in GST pulldown experiments. Input levels of E2F1, as well as E2F1 from GST-RBLP and GST-only pulldowns, were detected by Western blotting.
Fig 2
Fig 2
pRB-E2F1 interactions in IMR90 cells following DNA damage. (A) IMR90 cells were treated with 100 μM etoposide for 8 h, and nuclear extracts were prepared. Western blots display the levels of E2F1 and pRB in response to DNA damage. Blots of p53 pSer15 and lamin A/C control for DNA damage treatment and loading, respectively. (B) Schematic diagram of quantitative immunoprecipitation (qIP) method. All pRB-containing complexes are first removed from nuclear extracts by immunoprecipitation, and depleted supernatant is retained as a control for the quantitative nature of the IP. The immunoprecipitated fraction is resuspended in an volume equivalent to that of the supernatant and used in Western blot analysis. (C) Anti-pRB and anti-E2F1 Western blots demonstrate their respective levels in each fraction from quantitative immunoprecipitations of untreated and etoposide-treated cells.
Fig 3
Fig 3
Development of GST-RBLP binding assays to investigate pRB-free E2F1 following DNA damage. (A) U2OS cells were treated with 100 μM etoposide for 8 h, and whole-cell extracts were prepared. Equal quantities of extract were mixed with the indicated GST-RBLP fusion proteins before they were precipitated on beads and analyzed by SDS-PAGE and Western blotting. Input levels of the various GST proteins are shown by SDS-PAGE and Coomassie blue staining. (B) Extracts were prepared as described above, but this time the input amount used in GST pulldown experiments was normalized to E2F1. For simplicity, this type of experiment was used for Fig. 4.
Fig 4
Fig 4
Serine 31 phosphorylation and lysine acetylation of E2F1 are necessary to form a pRB-free fraction of E2F1. (A) Schematic diagram of HA-E2F1 expression vectors used in this study. Substitutions of serine to alanine and/or lysine to arginine found in each construct are shown. The corresponding name for each mutant is also shown to the left. (B) U2OS cells were cotransfected with expression vectors for HA-E2F1 and HA-DP1 or for HA-E2F1-TM and HA-DP1. Cultures were equally divided, and one was treated with 100 μM etoposide for 8 h and the other with DMSO as a control. Relative levels of exogenous HA-E2F1, HA-DP1, total E2F1, p53 pSer15, and β-actin were determined by Western blotting. (C) Whole-cell extracts from treated and untreated controls were normalized for E2F1 levels. Normalized extracts were mixed with the indicated GST fusion proteins, coprecipitated on beads, and detected by Western blotting for the HA epitope on exogenous HA-E2F1 and HA-E2F1-TM. (D) U2OS cells were transfected with HA-E2F1, HA-E2F1-TM, HA-E2F1-KR, HA-E2F1-S31A, or HA-E2F1-S364A expression vectors along with HA-DP1. Cultures were split and each half treated with DMSO or 100 μM etoposide for 8 h. Relative expression levels of HA-E2F1 proteins, p53 pSer15, and β-actin from whole-cell lysates were determined by Western blotting. (E) Whole-cell extracts from panel D were normalized for E2F1 levels, mixed with the indicated GST fusion proteins, and coprecipitated on beads, and E2F1 was detected by Western blotting for HA. (F) Etoposide-treated extracts and GST-RBLP-bound E2F1 were Western blotted to detect total levels of E2F1 and E2F1 pSer364.
Fig 5
Fig 5
Mutually exclusive posttranslational modifications on E2F1 complexes following DNA damage. (A) U2OS cells were treated with 100 μM etoposide for 8 h, after which nuclear extracts were prepared and normalized to E2F1 levels (shown in the upper panel). E2F1 was immunoprecipitated with anti-E2F1 pSer364 antibodies and detected by Western blotting. (B) Nuclear extracts from etoposide-treated cells were quantitatively immunoprecipitated to produce pRB-E2F1 and pRB-free E2F1 fractions. IP samples were normalized with respect to E2F1 levels and Western blotted for pRB, E2F1 pSer364, and total E2F1. (C) Nuclear extracts from etoposide-treated cells were immunoprecipitated with the indicated antibodies, and samples were normalized with respect to E2F1 levels. Western blots for pRB, E2F1 pSer364, and total E2F1 are shown. (D) Nuclear extracts from etoposide-treated cells were immunoprecipitated with the indicated antibodies and Western blotted using an anti-pRB pSer612-specific antibody and an anti-E2F1 pSer364 antibody. (E) Nuclear extracts from etoposide-treated cells were immunoprecipitated with the indicated antibodies, and IP samples were normalized with respect to total E2F1. Western blots for pRB, acetylated lysine, E2F1 pSer364, and total E2F1 were used to assay the posttranslational modifications present on both pRB and E2F1 in response to DNA damage. ppRB represents hyperphosphorylated pRB, and pRB represents hypophosphorylated pRB; they were determined by relative migration in SDS-PAGE. (F) Extracts from etoposide-treated cells were quantitatively precipitated with anti-pRB antibodies, and the precipitate and supernatant were blotted for TopBP1, pRB, and E2F1 to determine their presence in these fractions. (G) Model summarizing posttranslational modifications implicated in the distinct pRB-E2F1 complex characterized in this figure.
Fig 6
Fig 6
E2F1 mutants complement cell cycle and transcription defects in E2f1−/− cells. (A) Wild-type mouse embryonic fibroblasts (wt MEF) and E2f1−/− 3T3 cells were treated with DMSO or 100 μM etoposide for 8 h, after which extracts were analyzed by Western blotting. Relative expression levels of p53 and p21 are shown. β-Actin serves as a loading control. (B) The indicated empty vector or E2F1-reconstituted (-WT, -TM, -DM, or -S364A) E2f1−/− 3T3 cells were treated as for panel A, after which whole-cell extracts were analyzed by Western blotting for E2F1 and β-actin. (C) The indicated E2F1-reconstituted E2f1−/− 3T3 cells were treated with 100 μM etoposide for 8 h. Nuclear extracts were prepared and immunoprecipitated with the indicated antibodies. Immunoprecipitated E2F1 was detected by Western blot analysis. (D) Growth curves for the indicated E2F1-reconstituted 3T3 lines. The total cell number was counted every 24 h following plating for 6 days. Error bars indicate one standard deviation from the mean (n = 3). (E) Asynchronously growing cultures of the indicated E2F1-reconstituted E2f1−/− 3T3 cells were pulse-labeled with BrdU for 1 h, processed for BrdU and PI staining, and analyzed by flow cytometry. Results are graphed as the percentage of total cells in G0/G1, S, or G2/M. Error bars indicate one standard deviation from the mean (n = 3). (F) RNA was extracted from reconstituted E2f1−/− 3T3 cells, and cyclin A2 and cyclin E1 expression was assayed by real-time RT-PCR. Results are normalized to the expression of β-actin and shown relative to the levels observed in empty-vector-transduced cells (set to 1). Error bars indicate one standard deviation from the mean (n = 3).
Fig 7
Fig 7
Multiple E2F1 complexes are required for transcription of proapoptotic genes and induction of apoptosis. (A) Reconstituted E2f1−/− 3T3 cells were treated with 100 μM etoposide or DMSO for 6 h. RNA was extracted, and TA-p73 and caspase-7 induction was assayed by real-time RT-PCR. Results are normalized to the expression of β-actin and shown relative to the levels observed in untreated cells (set to 1). Error bars indicate one standard deviation from the mean (n = 3). Means were compared by the t test, and the resulting P values are indicated. (B) Cyclin A2 and cyclin E1 induction was assayed by real-time RT-PCR as for panel A. Fold induction is shown relative to the levels observed in untreated cells (set to 1). (C) Reconstituted E2f1−/− 3T3 cells were treated with 10 μM etoposide for 24 h. Cell viability was determined by using the alamarBlue cell viability reagent and measuring fluorescence at 570 nm. Percent viability is represented as relative to the levels observed in empty-vector-transduced cells. Error bars indicate one standard deviation from the mean (n = 3). Means were compared by the t test, and the resulting P values are indicated. (D) E2f1−/− 3T3 cells were treated with DMSO or 10 μM or 25 μM etoposide for 24 h. Apoptosis was quantitated by fluorescence emission created by cleavage of a rhodamine-linked caspase-3/7 substrate. Error bars indicate one standard deviation from the mean (n = 3). Means were compared by the t test, and the resulting P values are indicated. (E) HA-E2F1 was immunoprecipitated from extracts of untreated and treated 3T3 cells containing empty vector, HA-E2F1, or HA-E2F1-S364A. The levels of precipitated HA-E2F1 and pRB were determined by Western blotting.
Fig 8
Fig 8
E2F1 localization to the TA-p73 promoter in response to DNA damage. A graph of real-time PCR data from E2F1 and E2F1 pSer364 ChIP experiments is shown. A region proximal to the TA-p73 start site that is surrounded by multiple E2F binding sites was amplified along with a region of the GAPDH promoter as a negative control. Error bars indicate one standard deviation from the mean (n = 3). Means were compared by the t test, and the resulting P values are indicated.
Fig 9
Fig 9
DNA damage induces the proapoptotic activity of E2F1 through multiple signaling pathways. (A) DNA damage leads to the formation of a hyperphosphorylated pRB-E2F1 complex. This complex requires phosphorylation of serine 364 of E2F1 to support maximal activation of proapoptotic target genes such as that for TA-p73, and it is physically present at the TA-p73 promoter. In addition, a pRB-free fraction of E2F1 is generated through phosphorylation of serine 31 and acetylation of lysine residues. Phosphorylation of S31 is known to recruit 14-3-3τ or TopBP1, and other factors may also participate in this complex. Serine 31 phosphorylation and lysine acetylation of E2F1 are also required for the maximal induction of TA-p73 and caspase-7 transcription, and these modifications have been shown to recruit E2F1 to the TA-p73 promoter. Therefore, multiple distinct molecular complexes containing E2F1 are utilized in the DNA damage response to induce transcription and apoptosis. (B) Conservation of amino acid identity in mammalian E2F1 proteins surrounding the pSer364 site. Sequences from human, chimpanzee, rhesus monkey, cow, mouse, and rat are shown. The consensus Chk2 phosphorylation site is shown at the bottom.

References

    1. Aparicio O, et al. 2005. Chromatin immunoprecipitation for determining the association of proteins with specific genomic sequences in vivo, p 21.23.21–21.23.33 In Ausubel FM, Brent R, Kington RE, Moore DD, Seidman JG, Smith JA, Struhl KE. (ed), Current protocols in molecular biology. Greene Publishing Associates, New York, NY - PubMed
    1. Avni D, et al. 2003. Active localization of the retinoblastoma protein in chromatin and its response to S phase DNA damage. Mol. Cell 12:735–746 - PubMed
    1. Bates S, et al. 1998. p14ARF links the tumour suppressors RB and p53. Nature 395:124–125 - PubMed
    1. Blattner C, Sparks A, Lane D. 1999. Transcription factor E2F-1 is upregulated in response to DNA damage in a manner analogous to that of p53. Mol. Cell. Biol. 19:3704–3713 - PMC - PubMed
    1. Brugarolas J, et al. 1999. Inhibition of cyclin-dependent kinase 2 by p21 is necessary for retinoblastoma protein-mediated G1 arrest after gamma-irradiation. Proc. Natl. Acad. Sci. U. S. A. 96:1002–1007 - PMC - PubMed

Publication types