

AGR2 gene function requires a unique endoplasmic reticulum localization motif
- PMID: 22184114
- PMCID: PMC3281655
- DOI: 10.1074/jbc.M111.301531
AGR2 gene function requires a unique endoplasmic reticulum localization motif
Abstract
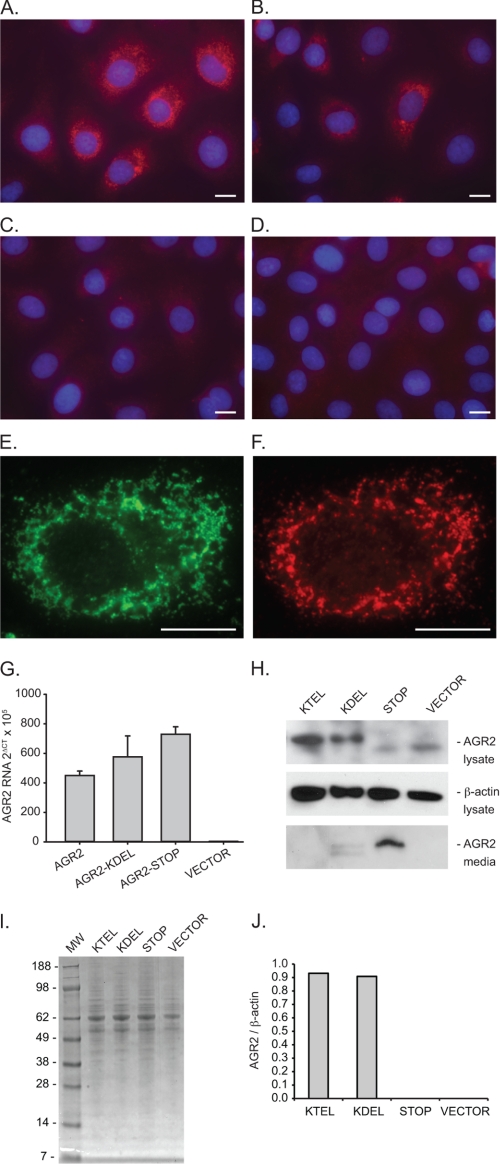
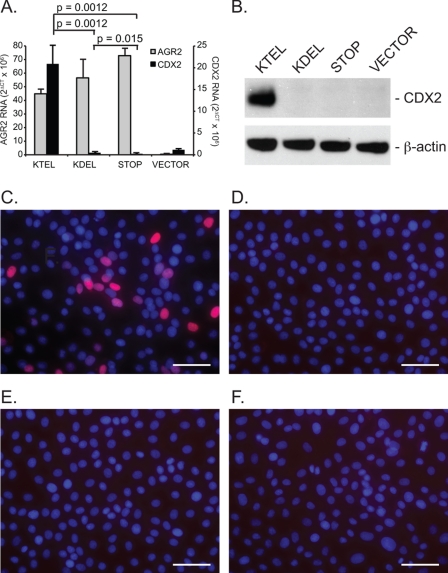
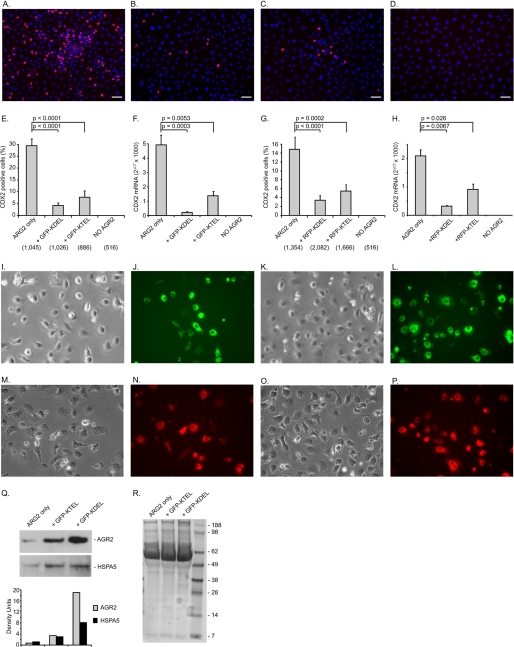
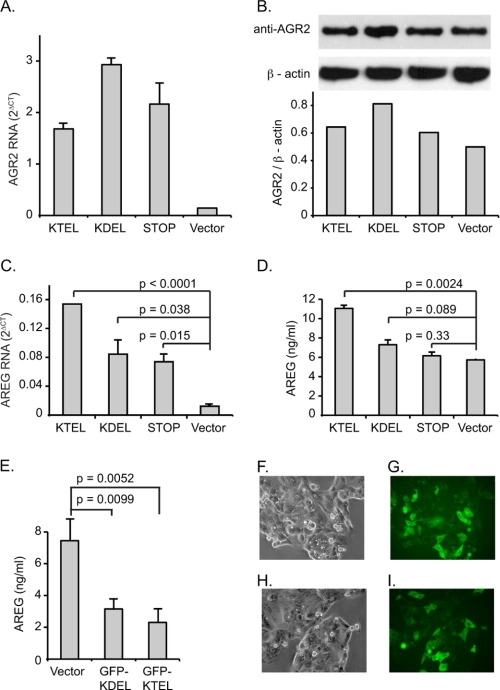
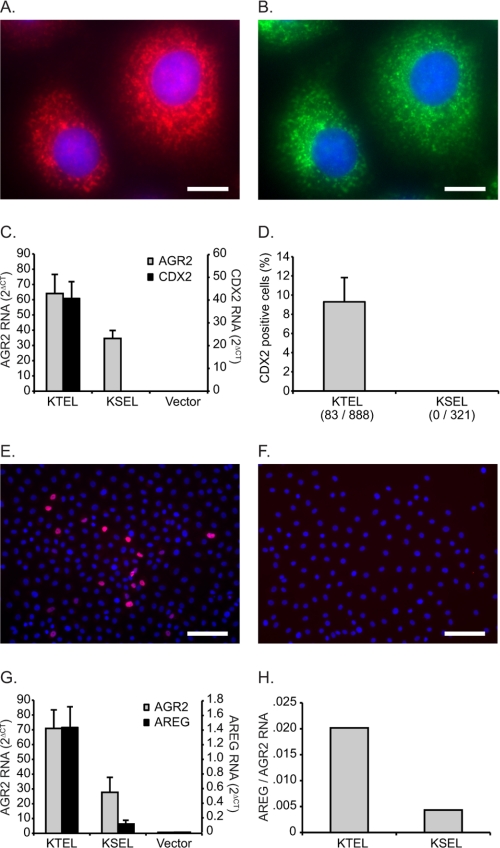
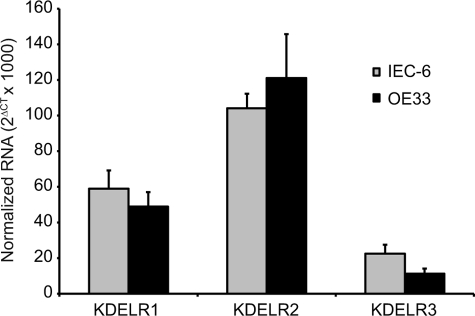
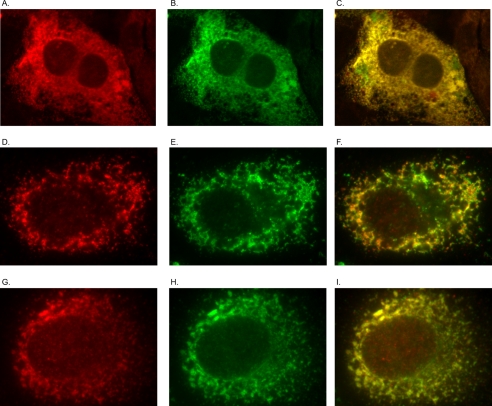
Soluble proteins are enriched in the endoplasmic reticulum (ER) by retrograde transport from the Golgi that is mediated by the KDEL receptors. In addition to the classic carboxyl-terminal KDEL motif, a variety of sequence variants are also capable of receptor binding that result in ER localization. Although different ER localization signals that exhibit varying affinities for the KDEL receptors exist, whether there are functional implications was unknown. The present study determines whether AGR2 requires a specific ER localization signal to be functionally active. AGR2 is expressed in most human adenocarcinomas and serves a role in promoting growth and the transformed phenotype. Using two different cell lines in which AGR2 induces expression of either the EGFR ligand amphiregulin or the transcription factor CDX2, only the highly conserved wild-type carboxyl-terminal KTEL motif results in the appropriate outcome. Deletion of the KTEL motif results in AGR2 secretion and loss of AGR2 function. AGR2 function is also lost when ER residence is achieved with a carboxyl-terminal KDEL or KSEL instead of a KTEL motif. Thus variations in ER localization sequences may serve a specific functional role, and in the case of AGR2, this role is served specifically by KTEL.
Figures
Similar articles
-
The human adenocarcinoma-associated gene, AGR2, induces expression of amphiregulin through Hippo pathway co-activator YAP1 activation.J Biol Chem. 2011 May 20;286(20):18301-10. doi: 10.1074/jbc.M110.215707. Epub 2011 Mar 26. J Biol Chem. 2011. PMID: 21454516 Free PMC article.
-
Epidermal growth factor receptor (EGFR) signaling requires a specific endoplasmic reticulum thioredoxin for the post-translational control of receptor presentation to the cell surface.J Biol Chem. 2015 Mar 27;290(13):8016-27. doi: 10.1074/jbc.M114.623207. Epub 2015 Feb 9. J Biol Chem. 2015. PMID: 25666625 Free PMC article.
-
A molecular specificity code for the three mammalian KDEL receptors.J Cell Biol. 2007 Dec 17;179(6):1193-204. doi: 10.1083/jcb.200705180. J Cell Biol. 2007. PMID: 18086916 Free PMC article.
-
The anterior gradient-2 interactome.Am J Physiol Cell Physiol. 2020 Jan 1;318(1):C40-C47. doi: 10.1152/ajpcell.00532.2018. Epub 2019 Oct 23. Am J Physiol Cell Physiol. 2020. PMID: 31644305 Review.
-
Pathogenic Effects of Impaired Retrieval between the Endoplasmic Reticulum and Golgi Complex.Int J Mol Sci. 2019 Nov 9;20(22):5614. doi: 10.3390/ijms20225614. Int J Mol Sci. 2019. PMID: 31717602 Free PMC article. Review.
Cited by
-
Anterior Gradient 2 (AGR2) Induced Epidermal Growth Factor Receptor (EGFR) Signaling Is Essential for Murine Pancreatitis-Associated Tissue Regeneration.PLoS One. 2016 Oct 20;11(10):e0164968. doi: 10.1371/journal.pone.0164968. eCollection 2016. PLoS One. 2016. PMID: 27764193 Free PMC article.
-
AGR2-induced cholesterol synthesis drives lovastatin resistance that is overcome by combination therapy with allicin.Acta Pharmacol Sin. 2022 Nov;43(11):2905-2916. doi: 10.1038/s41401-022-00909-3. Epub 2022 Apr 22. Acta Pharmacol Sin. 2022. PMID: 35459869 Free PMC article.
-
Non-Canonical, Strongly Selective Protein Disulfide Isomerases as Anticancer Therapeutic Targets.Biomolecules. 2025 Aug 8;15(8):1146. doi: 10.3390/biom15081146. Biomolecules. 2025. PMID: 40867591 Free PMC article. Review.
-
Secretion of pro-oncogenic AGR2 protein in cancer.Heliyon. 2020 Sep 23;6(9):e05000. doi: 10.1016/j.heliyon.2020.e05000. eCollection 2020 Sep. Heliyon. 2020. PMID: 33005802 Free PMC article. Review.
-
The metastasis-inducing protein AGR2 is O-glycosylated upon secretion from mammary epithelial cells.Mol Cell Biochem. 2015 Oct;408(1-2):245-52. doi: 10.1007/s11010-015-2502-3. Epub 2015 Jul 14. Mol Cell Biochem. 2015. PMID: 26169982 Free PMC article.
References
-
- Lewis M. J., Sweet D. J., Pelham H. R. (1990) The ERD2 gene determines the specificity of the luminal ER protein retention system. Cell 61, 1359–1363 - PubMed
-
- Semenza J. C., Hardwick K. G., Dean N., Pelham H. R. (1990) ERD2, a yeast gene required for the receptor-mediated retrieval of luminal ER proteins from the secretory pathway. Cell 61, 1349–1357 - PubMed
-
- Munro S., Pelham H. R. (1987) A C-terminal signal prevents secretion of luminal ER proteins. Cell 48, 899–907 - PubMed
Publication types
MeSH terms
Substances
Grants and funding
LinkOut - more resources
Full Text Sources
Molecular Biology Databases
Research Materials
Miscellaneous
