. 2012 Mar 16;287(12):9514-24.
doi: 10.1074/jbc.M111.313940. Epub 2011 Dec 19.

Type 1 diabetes-associated HLA-DQ8 transdimer accommodates a unique peptide repertoire

Affiliations

Type 1 diabetes-associated HLA-DQ8 transdimer accommodates a unique peptide repertoire

Menno van Lummel et al. J Biol Chem. .

Abstract

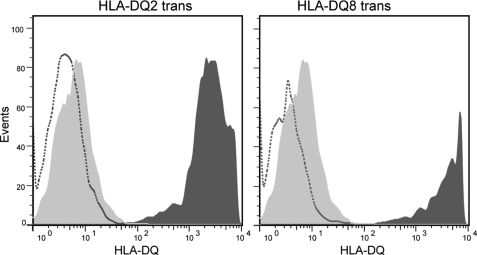
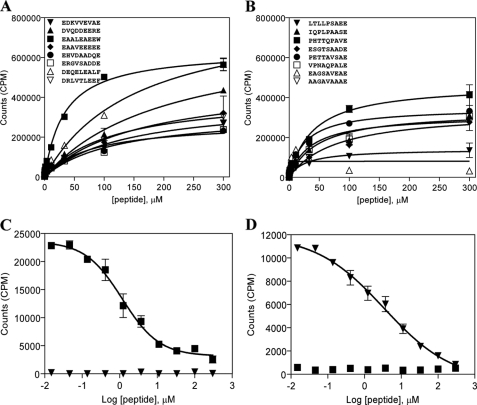
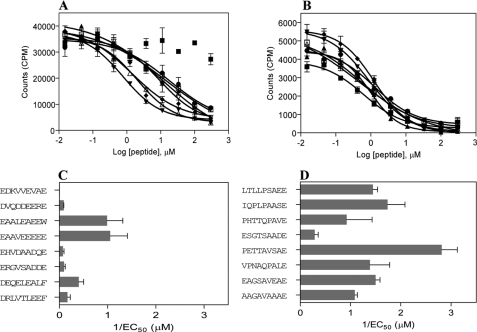
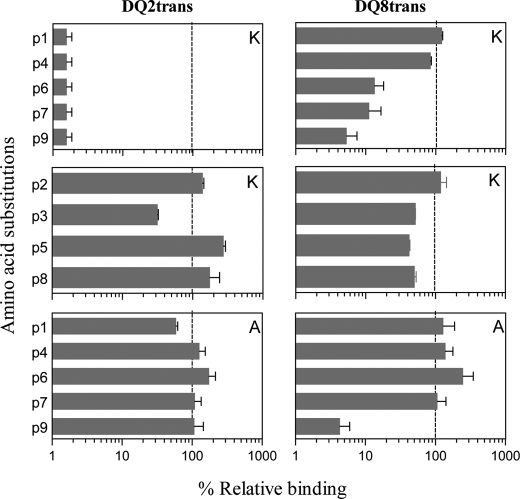
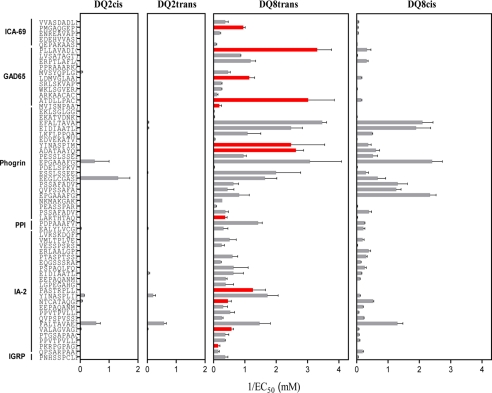
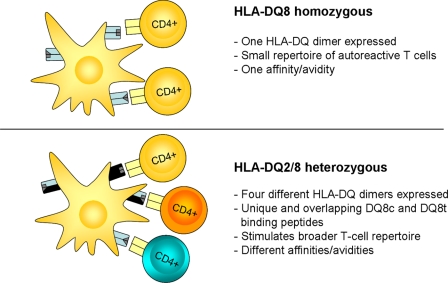
HLA-DQ2 and HLA-DQ8 are strongly predisposing haplotypes for type 1 diabetes (T1D). Yet HLA-DQ2/8 heterozygous individuals have a synergistically increased risk compared with HLA-DQ2 or HLA-DQ8 homozygote subjects that may result from the presence of a transdimer formed between the α-chain of HLA-DQ2 (DQA1*05:01) and the β-chain of HLA-DQ8 (DQB1*03:02). We generated cells exclusively expressing this transdimer (HLA-DQ8trans), characterized its peptide binding repertoire, and defined a unique transdimer-specific peptide binding motif that was found to be distinct from those of HLA-DQ2 and HLA-DQ8. This motif predicts an array of peptides of islet autoantigens as candidate T cell epitopes, many of which selectively bind to the HLA transdimer, whereas others bind to both HLA-DQ8 and transdimer with similar affinity. Our findings provide a molecular basis for the association between HLA-DQ transdimers and T1D and set the stage for rational testing of potential diabetogenic peptide epitopes.


Figures

FIGURE 1.
FIGURE 1.
Expression of HLA-DQ2/8 transdimers on viral-transduced HEK293 cells. Expression of the DQ transdimer molecules on HEK293 cells was examined by FACS analysis using a phosphatidylethanolamine-conjugated pan-HLA-DQ antibody (clone 1a3, Leinco Technologies). Shown is HLA-DQ expression on the surface of transduced cells (dark gray) compared with non-transduced HEK293 cells (dashed line), which do not naturally express MHC class II molecules. An isotype control antibody for SPV-L3 was included in the FACS experiments (light gray). Cells were single cell-sorted to obtain clones with high DQ expression. Clones obtained by this strategy displayed >95% DQ expression, which was stable in time (not shown).
FIGURE 2.
FIGURE 2.
Binding of a selected panel of HLA-DQ2trans and HLA-DQ8trans peptides representing the identified binding cores. Randomly selected panels of 8 DQ2trans- and 8 DQ8trans-eluted peptides containing the identified binding cores were synthesized as 13-mers containing two extra alanines, both N- and C-terminally necessary for proper DQ binding. Binding of a titration range (0–300 μm) of peptides was tested in a direct binding assay or in a competitive binding assay using a fixed concentration (0.6 μm) of biotinylated indicator peptide. A and B, shown is direct binding of a panel of 8 DQ2trans- and 8 DQ8trans- eluted peptides to DQ2trans (A) and DQ8trans (B). C and D, shown is competitive binding of the biotinylated DQ2trans indicator peptide AAEAALEAEEWAA (▼) and DQ8trans indicator peptide AAPHTTQPAVEAA (■) versus the same non-biotinylated peptide to DQ2trans (C) and DQ8trans (D). Data represent mean ± S.E. (n = 3).
FIGURE 3.
FIGURE 3.
Binding of selected panels of HLA-DQ2trans and HLA-DQ8trans peptides in a competitive peptide binding assay. The two panels of 8 DQ2trans and DQ8trans peptides were tested in a titration range (0–300 μm) for binding in a competitive binding assay using a fixed concentration (0.6 μm) of the selected biotinylated indicator peptides AAEAALEAEEWAA (DQ2trans) and AAPHTTQPAVEAA (DQ8trans). A and B show competitive binding of the peptide panels to DQ2trans and DQ8trans, respectively. C and D show EC50 values were calculated based on the observed competition between the biotinylated indicator peptides and the test peptides for DQ2trans and DQ8trans, respectively. EC50 represents the concentration of the test peptide that is required for 50% inhibition of the binding of the indicator peptide. Data represent the mean ± S.E. (n = 3). Shown on the x axes is 1/EC50, thereby illustrating that large bars represent better binding.
FIGURE 4.
FIGURE 4.
Amino acid substitutions at anchor and non-anchor positions within the HLA-DQ2trans and HLA-DQ8trans indicator peptides. Binding of p1/p4/p6/p7/p9 (anchor) Lys-substituted DQ2trans indicator peptide AAEAALEAEEWAA and DQ8trans indicator peptide AAPHTTQPAVEAA to their respective transdimer is shown. Also, binding of p2/p3/p5/p8 Lys-substituted DQ2trans indicator peptide and DQ8trans indicator peptide was tested. Binding of A-substituted indicator peptides to DQ2trans and DQ8trans is shown. EC50 values were calculated on the basis of competition between the biotinylated indicator peptide and the non-biotinylated Lys-substituted test peptides. EC50 represents the concentration of the test peptide that is required for 50% inhibition of the binding of the indicator peptide. Data represent the mean ± S.E. (n = 3). Shown on the x axes is % relative binding of peptide without any substitutions (dashed line).
FIGURE 5.
FIGURE 5.
Binding of predicted HLA-DQ8trans candidate epitopes with double mismatches to all four HLA-DQ2/8 molecules. Prediction of potential DQ8trans epitopes within the top known diabetogenic proteins was performed with double mismatches at the anchor positions of the DQ8trans binding motif using the algorithm program MOTIFS. A selection of 46 potential DQ8trans epitopes was tested for binding all four DQ2/8 cis and trans molecules. EC50 values were calculated on the basis of competition between the biotinylated indicator peptide and the test peptides. Data represent the mean ± S.E. (n = 3). Shown on the x axes is 1/EC50, thereby illustrating that large bars represent better binding. Red bars represent HLA-DQ8trans-specific peptides. PPI, preproinsulin; IGRP, glucose-6-phosphatase catalytic subunit-related protein.
FIGURE 6.
FIGURE 6.
Proposed concept for the high risk association of HLA-DQ2/8 heterozygosity with development of T1D. HLA-DQ8 homozygous individuals only express a single HLA-DQ dimer on the surface of APCs, resulting in the presentation of a select number of epitopes and induction of a small repertoire of autoreactive CD4 T cells. Individuals heterozygous for the high risk-associated HLA-DQ2/8 haplotype can express multiple HLA-DQ dimers on APCs, consequently resulting in the presentation of a diversity of auto-antigen-derived epitopes and induction of a broader repertoire of autoreactive CD4 T cells. This may underlie the association of HLA-DQ2/8 with development of T1D.

References

    1. Atkinson M. A., Maclaren N. K. (1994) The pathogenesis of insulin-dependent diabetes mellitus. N. Engl. J. Med. 331, 1428–1436 - PubMed
    1. Bluestone J. A., Herold K., Eisenbarth G. (2010) Genetics, pathogenesis, and clinical interventions in type 1 diabetes. Nature 464, 1293–1300 - PMC - PubMed
    1. van Belle T. L., Coppieters K. T., von Herrath M. G. (2011) Type 1 diabetes. Etiology, immunology, and therapeutic strategies. Physiol. Rev. 91, 79–118 - PubMed
    1. Kent S. C., Chen Y., Bregoli L., Clemmings S. M., Kenyon N. S., Ricordi C., Hering B. J., Hafler D. A. (2005) Expanded T cells from pancreatic lymph nodes of type 1 diabetic subjects recognize an insulin epitope. Nature 435, 224–228 - PubMed
    1. Miller G. G., Pollack M. S., Nell L. J., Thomas J. W. (1987) Insulin-specific human T cells. Epitope specificity, major histocompatibility complex restriction, and alloreactivity to a diabetes-associated haplotype. J. Immunol. 139, 3622–3629 - PubMed

Publication types