. 2011 Dec 26;195(7):1185-203.
doi: 10.1083/jcb.201106057. Epub 2011 Dec 19.

Desmosomal cadherins utilize distinct kinesins for assembly into desmosomes

Affiliations

Desmosomal cadherins utilize distinct kinesins for assembly into desmosomes

Oxana E Nekrasova et al. J Cell Biol. .

Erratum in

  • J Cell Biol. 2012 Jan 23;196(2):297
  • J Cell Biol. 2013 Jun 24;201(7):1085

Abstract

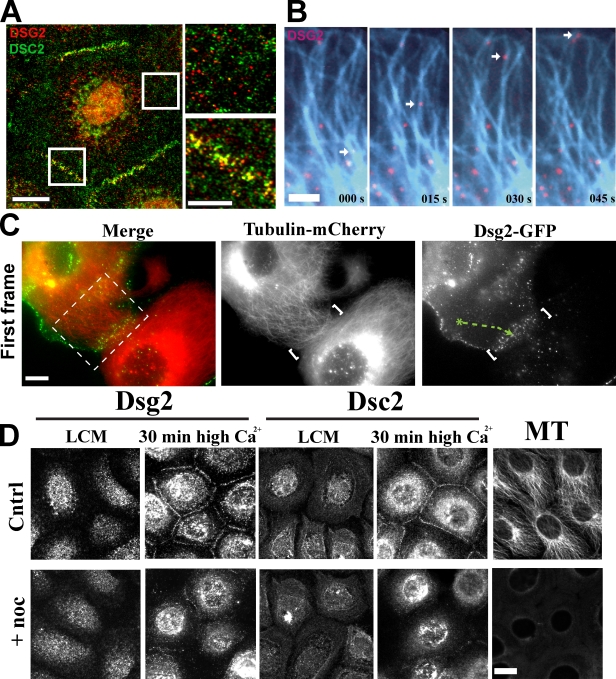
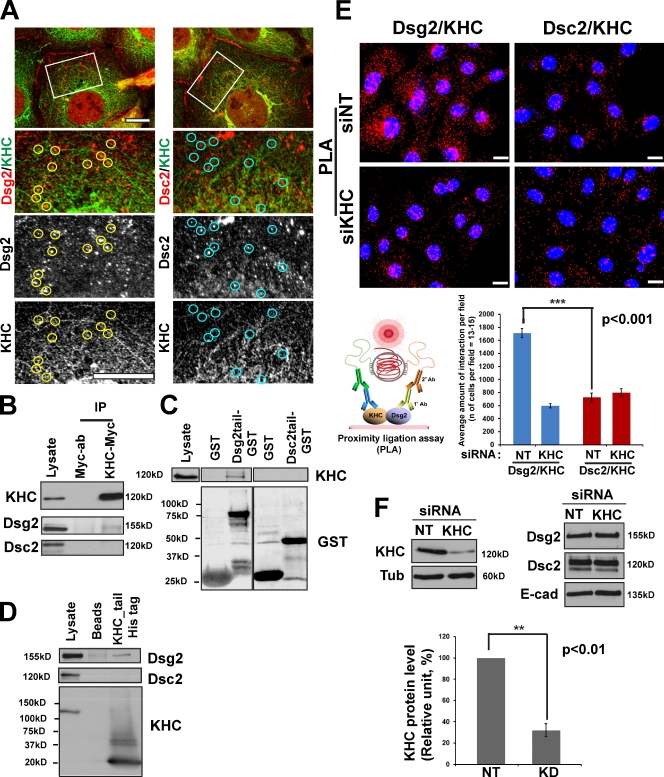
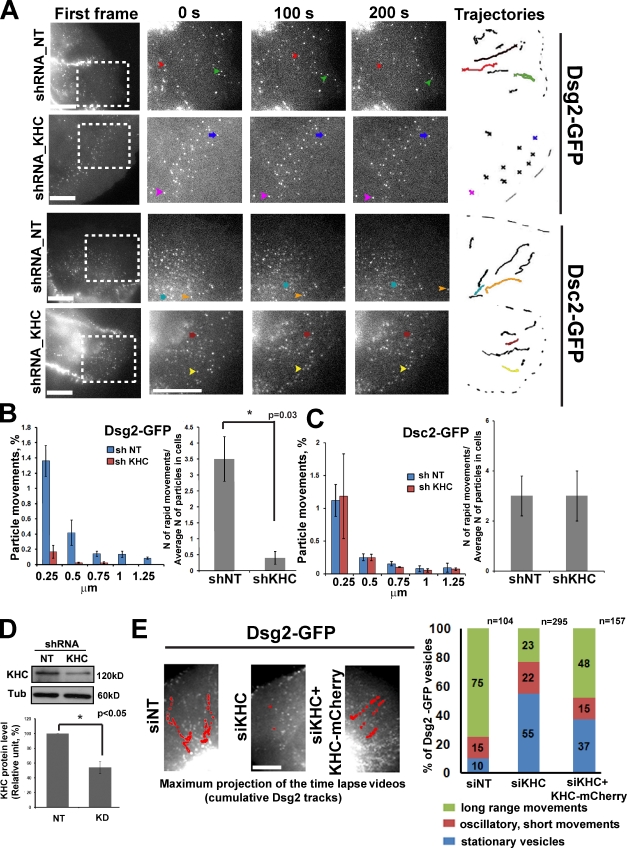
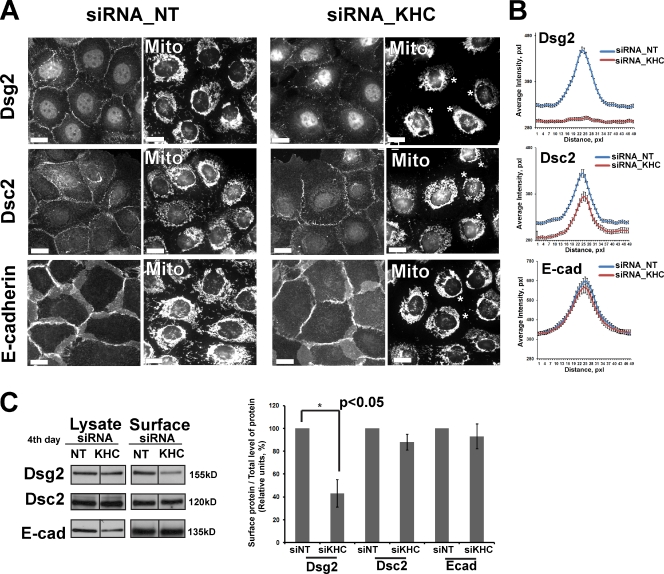
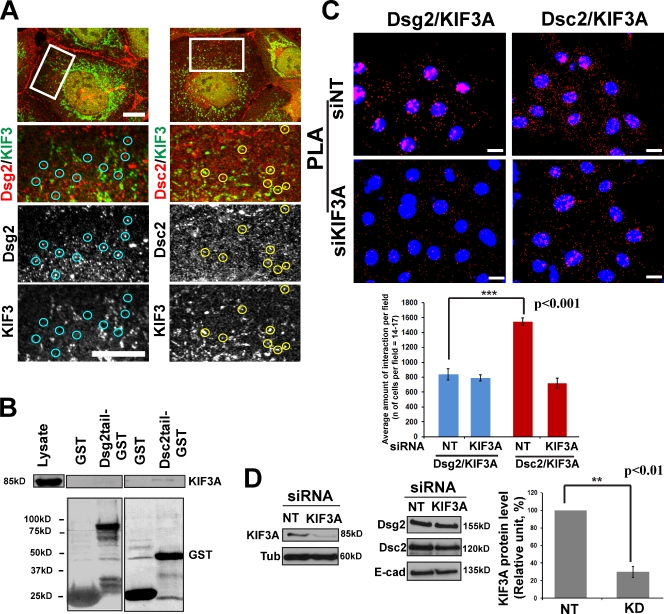
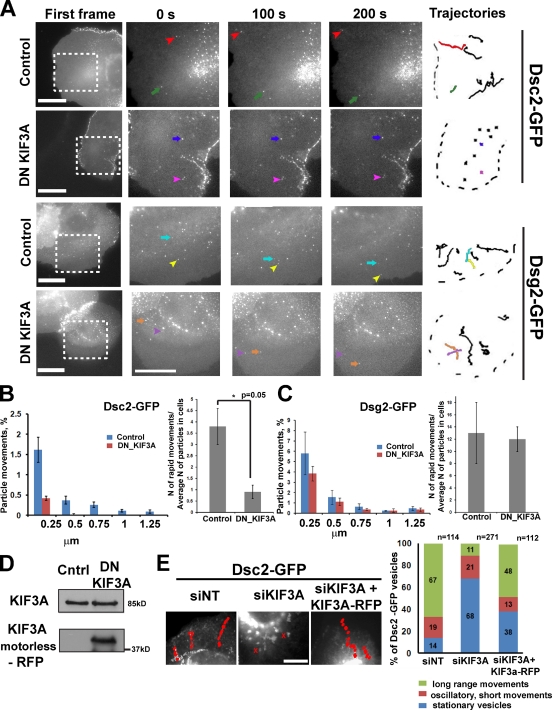
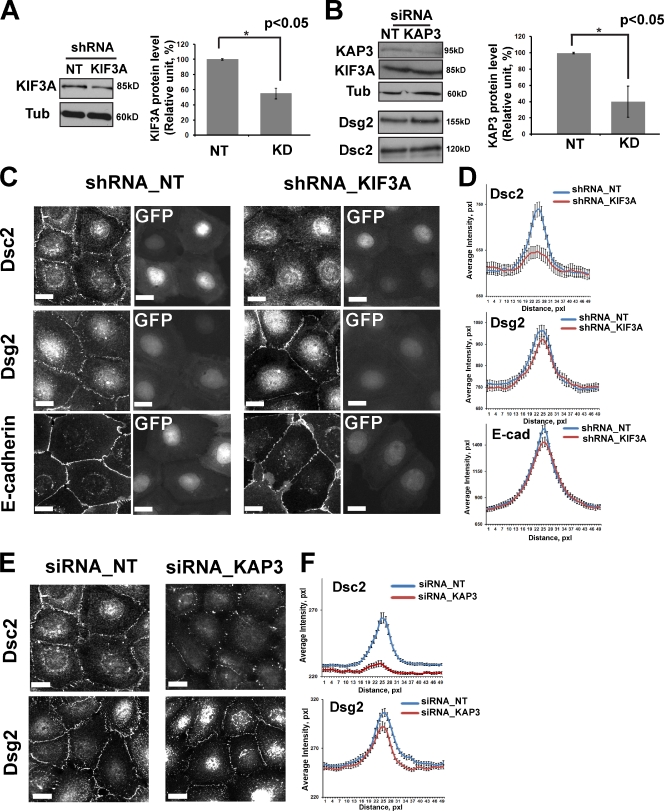
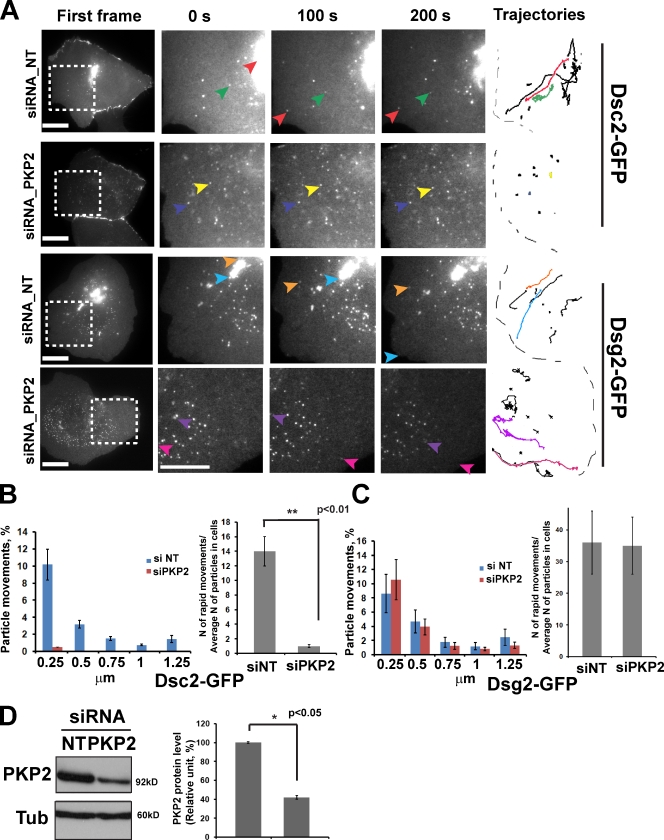
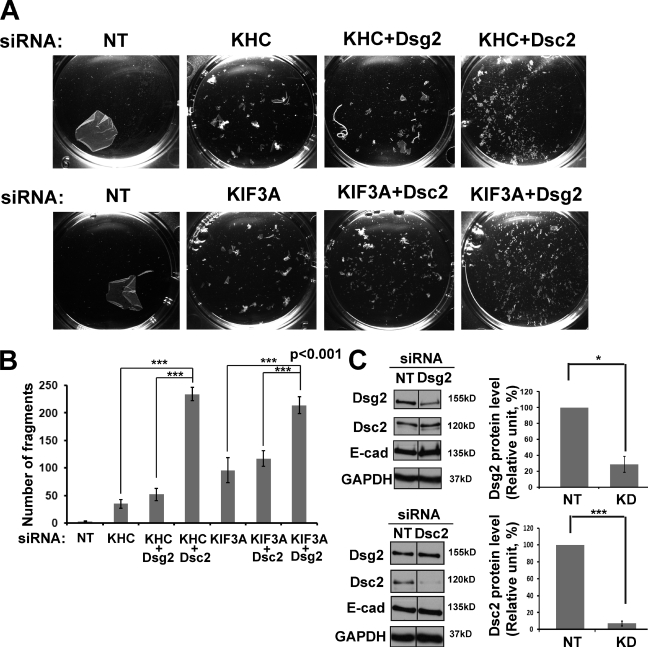
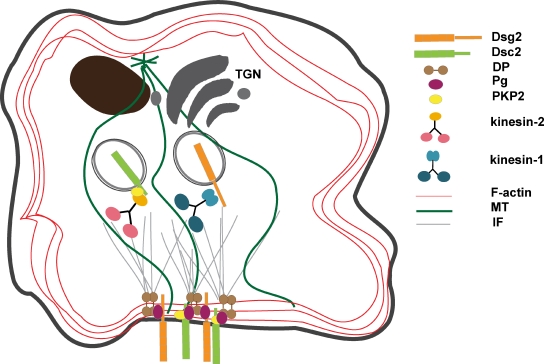
The desmosomal cadherins, desmogleins (Dsgs) and desmocollins (Dscs), comprise the adhesive core of intercellular junctions known as desmosomes. Although these adhesion molecules are known to be critical for tissue integrity, mechanisms that coordinate their trafficking into intercellular junctions to regulate their proper ratio and distribution are unknown. We demonstrate that Dsg2 and Dsc2 both exhibit microtubule-dependent transport in epithelial cells but use distinct motors to traffic to the plasma membrane. Functional interference with kinesin-1 blocked Dsg2 transport, resulting in the assembly of Dsg2-deficient junctions with minimal impact on distribution of Dsc2 or desmosomal plaque components. In contrast, inhibiting kinesin-2 prevented Dsc2 movement and decreased its plasma membrane accumulation without affecting Dsg2 trafficking. Either kinesin-1 or -2 deficiency weakened intercellular adhesion, despite the maintenance of adherens junctions and other desmosome components at the plasma membrane. Differential regulation of desmosomal cadherin transport could provide a mechanism to tailor adhesion strength during tissue morphogenesis and remodeling.


Figures

Figure 1.
Figure 1.
Desmosomal cadherins require MTs for rapid accumulation at intercellular junctions. (A) Dual-label immunofluorescence revealed that Dsg2 and Dsc2 colocalize at cell–cell junctions but are present in separate cytoplasmic vesicles. Boxes indicate areas of magnification on the right. (B) Cells coexpressing Dsg2-GFP and tubulin-mCherry (blue) were imaged at 5-s intervals (Video 2). Dsg2-containing vesicles move along MTs toward the plasma membrane. (C) Contacting cells expressing Dsg2-GFP and tubulin-mCherry were imaged at 5-s intervals. Video 3 shows the cropped area in the left image. White brackets indicate cell–cell contact. Green track shows the path taken by a Dsg2-containing vesicle to the contact site. (D) Scc9s were switched to low-calcium medium (LCM) for 2 h before incubation with nocodazole for 1 h in low-calcium medium and then switched to normal Ca2+ (with or without nocodazole) for 30 min to trigger junction assembly. Cytoplasmic Dsg2 and Dsc2 vesicles are present in control (Cntrl) and nocodazole (noc)-treated cells in low-calcium medium. Disruption of MT delays Dsg2 and Dsc2 assembly at newly forming cell–cell interfaces. Bars: (A [left] and D) 20 µm; (A [right] and C) 10 µm; (B) 5 µm.
Figure 2.
Figure 2.
Dsg2 associates with kinesin-1. (A) Dual-label confocal microscopy showing Dsg2 (left) and Dsc2 (right) with KHC. Under these experimental conditions, the KHC antibody results in a combination of particulate and fibrous staining, the latter likely representing MTs. A subset of Dsg2-positive particles colocalize with KHC (yellow circles), whereas Dsc2-positive particles do not colocalize with KHC (blue circles). Boxes showed the zoomed areas. Bar, 10 µm. (B) Myc-tagged KIF5B was transfected into Scc9 cells, subjected to immunoprecipitation, and immunoblotted for Dsg2 and Dsc2. Dsg2, but not Dsc2, associated with KHC-Myc. (C) Recombinant Dsg2 cytoplasmic tail–GST or Dsc2 cytoplasmic tail–GST were incubated with Scc9 cell lysates. Retained proteins were immunoblotted for the presence of KHC. KHC associates with Dsg2 tail–GST but not Dsc2 tail–GST. (D) Recombinant His-tagged KHC tail was incubated with Scc9 cell lysates, and retained proteins were tested for the presence of desmosomal cadherins. Dsg2, but not Dsc2, associates with the KHC tail. (E) Proximity ligation assay (PLA) was performed as described in Materials and methods (bottom left) using primary antibodies directed against Dsg2 or Dsc2 coupled with KHC antibodies on nontargeting (NT) siRNA (siNT; top) or siKHC-treated Scc9 cells (middle). Red-labeled particles indicating protein complex formation were quantified (bottom right) to show significant Dsg2–KHC interactions compared with Dsc2–KHC (number of cells per condition = ∼195; ***, P < 0.001), which were abrogated upon KHC knockdown. Bars, 20 µm. (F) Level of KHC knockdown (KD) in PLA experiment shown above, representative of five experiments quantified below (**, P < 0.01). Protein expression levels of Dsg2, Dsc2, and E-cadherin (E-cad) shown in the top right do not change. Error bars represent SEM. Ab, antibody; Tub, tubulin.
Figure 3.
Figure 3.
KHC knockdown blocked movement of Dsg2 but not Dsc2. (A) First frames show areas (boxes) analyzed by live-cell imaging in control or KHC-deficient cells 3 d after transfection (Video 4). The three magnified columns highlight selected vesicles (arrows) at three time points. Vesicle trajectories taken from the analyzed area are shown on the right, where colored tracks represent the movement of selected vesicles. Bars, 20 µm. (B) Bar graphs show quantification of distribution of particle movements (equal to instantaneous velocity; for each set of bar P < 0.05) and the ratio of rapid movements to the average number of analyzed particles (15–20 particles per cell) in each cell (three to four cells were analyzed per experiment) for Dsg2 in control and knockdown (KD) conditions (*, P = 0.03 for the ratio of rapid movements). In kinesin-1–deficient cells, the number of particle movements and the ratio of rapid movements for Dsg2 were decreased compared with controls. shNT, shRNA nontargeting. (C) Distribution of particle movements and the ratio of rapid movements to the average amount of analyzed particles for Dsc2 in KHC knockdown cells are similar to the control (P = 0.9). (D) Immunoblot showing level of KHC knockdown (∼50%, n = 3; *, P < 0.05). α-Tubulin (Tub) is the loading control. (E) Maximum projection of time-lapse analysis of cells into which cDNAs encoding Dsg2-GFP or Dsc2-GFP (not depicted) were coinjected with or without KHC cDNA into the nuclei of nontargeting (NT) siRNA (siNT) or siKHC-silenced cells (Video 6). Representative trajectories of Dsg2-GFP movements are shown in red. Bar, 5 µm. Bar graph on right is a population analysis showing particles engaging in long-range, short-range, or stationary movements as a percentage of Dsg2-GFP vesicles. The percentage of long-range movements is partially restored by the KHC-mCherry rescue construct (*, P < 0.05). n above the bars represents the number of vesicle trajectories that have been analyzed. Number of cells that been analyzed: siRNA nontargeting treated = 7, siKHC treated = 9, and siKHC with KHC-mCherry coinjection = 7. Error bars represent SEM.
Figure 4.
Figure 4.
Knockdown of KHC impairs Dsg2 accumulation at the plasma membrane in Scc9 cells. (A) Scc9 cells in media with 1.2 mM Ca2+ were transfected with siRNA oligos against KHC or control nontargeted (NT) siRNA (siRNA_NT) for 2 d, replated and, after 24 h, stained with MitoTracker (Mito), fixed, and colabeled either for Dsg2, Dsc2, or E-cadherin (E-cad). Knockdown of kinesin-1 (indicated by mitochondria collapse, marked by asterisks) inhibits Dsg2 recruitment into the newly forming cell–cell interfaces but does not inhibit Dsc2 and E-cadherin accumulation. Level of knockdown in this experiment was comparable with that in Fig. 2 F. Bars, 20 µm. (B) Line scan analyses of border intensities for Dsg2, Dsc2, and E-cadherin were performed for ∼50 borders per each condition with three scans per border (n = ∼150 for each condition). Borders were chosen randomly from three independent experiments per condition. KHC knockdown results in loss of peak intensity for Dsg2 at cell–cell borders (P < 0.001) and decreased total pixel intensity of Dsc2 staining of ∼10% (P < 0.01). (C) Scc9 cells were transfected with siRNA oligos against KHC or nontargeting siRNA and were cell surface biotinylated 3 d after transfection. Biotinylated proteins were isolated by streptavidin pull-down, and levels of cell surface biotinylated Dsg2, Dsc2, and E-cadherin were identified by immunoblotting (compiled data from the same blot). Average of four independent experiments demonstrates a significant decrease in Dsg2 (*, P < 0.05) but not Dsc2 or E-cadherin cell surface expression. Black lines indicate that intervening lanes have been spliced out. Error bars represent SEM. pxl, pixel.
Figure 5.
Figure 5.
Dsc2 associates with kinesin-2. (A) Dual-label immunofluorescence confocal microscopy showing Dsc2 (right) and Dsg2 (left) with KIF3A. A subset of Dsc2-positive particles colocalize with KIF3A (yellow circles), whereas Dsg2-positive particles do not colocalize with KIF3A (blue circles). Boxes showed the zoomed areas. Bars, 10 µm. (B) Recombinant Dsg2 cytoplasmic tail–GST or Dsc2 cytoplasmic tail–GST were incubated with Scc9 cell lysates, and retained proteins were immunoblotted for the presence of KIF3A. KIF3A associates with Dsc2 tail–GST but not Dsg2 tail–GST. Note that the blot is the same as on Fig. 2 C. (C) PLA was performed using primary antibodies directed against Dsg2 or Dsc2 coupled with KIF3A antibodies on nontargeting (NT) siRNA (siNT; top) or siKIF3A-treated Scc9 cells (middle). Red particles were quantified, showing significant Dsc2–KIF3A interactions (***, P < 0.001) compared with Dsg2–KIF3A, which were abrogated upon KIF3A knockdown (bottom). Number of cells per condition = ∼240. Bars, 20 µm. (D) Level of KIF3A knockdown (KD) in the PLA experiment shown above, representative of three experiments on the right (**, P < 0.01). Protein expression level of Dsg2, Dsc2, and E-cadherin (E-cad) shown in the bottom middle were unchanged. Error bars represent SEM. Tub, tubulin.
Figure 6.
Figure 6.
Intracellular trafficking of Dsc2, but not Dsg2, was affected by blocking kinesin-2 function with DN KIF3A. (A) Representative videos show behavior of Dsg2- and Dsc2-GFP in cells imaged 12 h after double transfection with motorless DN KIF3A–RFP constructs. First frames show the areas (boxes) analyzed (Video 7), and the three magnified columns show selected vesicles (colored arrows) at three time points. Vesicle trajectories taken from the analyzed area are shown on the left, where colored tracks represent the movement of selected vesicles. Bars, 20 µm. (B) Distribution of particle movements (equal to instantaneous velocity; *, P < 0.05 for each set of bars) and the ratio of rapid movements to the average amount of analyzed particles (15–20 particles per cell) in each cell (three cells were analyzed per experiment) for Dsc2 in control cells and cells expressing the DN mutant (*, P = 0.05 for the ratio of rapid movements). Particle movements and the ratio of rapid movements for Dsc2 were decreased in cells with inhibited kinesin-2 function compared with control cells. (C) Distribution of long vectors and the ratio of long vectors to the average amount of analyzed particles (15–20 particles in each cell) for Dsg2 in cells expressing DN KIF3A are similar to that observed in control cells (P = 0.8). (D). Immunoblot showing level of DN KIF3A–RFP expression and total level of endogenous KIF3A for experiments in A and B. Cntrl, control. (E) Maximum projection of time-lapse analysis of cells into which cDNAs encoding Dsc2-GFP or Dsg2-GFP (not depicted) were coinjected with or without KIF3A cDNA into the nuclei of nontargeting (NT) siRNA (siNT) or siKIF3A-silenced cells (Video 8). Bar, 5 µm. Representative trajectories of Dsc2-GFP movements are shown in red. Bar graph on the right is a population analysis showing particles engaging in long-range, short-range, or stationary movements as a percentage of Dsc2-GFP vesicles. The percentage of long-range movements is partially restored by the KHC-mCherry rescue construct (P = 0.001). n above the bars represents the number of vesicles trajectories that have been analyzed. Number of cells: nontargeting siRNA = 8, siKIF3A = 10, and siKIF3A + KIF3A-RFP = 8.
Figure 7.
Figure 7.
Knockdown of KIF3A or KAP3 affects Dsc2, but not Dsg2, accumulation at junctions in Scc9 cells. KIF3A and KAP3 (kinesin-2 intermediate chain) functions were targeted with shRNA or siRNA, respectively. (A) Immunoblot demonstrating ∼50% reduction of KIF3A in shRNA-transfected cells (n = 3; *, P < 0.05). α-Tubulin (Tub) is the loading control. (B) Immunoblot demonstrating ∼60% decrease in KAP3 in siRNA-transfected cells (n = 5; *, P < 0.05). No change in expression of Dsg2 and Dsc2 was observed. (C) Scc9 cells were transiently transfected with a GFP-shRNA construct against KIF3A or nontargeting (NT) shRNA for 2 d, replated and, after 24 h, fixed and labeled either for Dsg2, Dsc2, or E-cadherin (E-cad). Knockdown (KD) of KIF3A (cells with GFP) delays Dsc2 recruitment into newly forming junctions but does not have a measurable effect on Dsg2 or E-cadherin localization at cell–cell borders. (D) Line scan analysis of border intensities for Dsc2, Dsg2, and E-cadherin were performed for ∼50 borders per each condition with three times scans per border (n = ∼150 for each condition). Borders were chosen randomly from three independent experiments per condition. KIF3A knockdown results in a decrease of peak intensity for Dsc2 at cell–cell borders compared with the control cells (P = 0.01). (E) Scc9 cells were transfected with siRNA oligos against KAP3 or control siRNA for 2 d, replated, and after 24 h, labeled either for Dsg2 or Dsc2. (F) KAP3 knockdown results in loss of the peak intensity for Dsc2 at the cell–cell border (P < 0.001). pxl, pixel. Bars, 20 µm.
Figure 8.
Figure 8.
PKP2 is required for long-range transport of Dsc2 but not Dsg2. (A) Scc9 cells were treated with control or siPKP2 oligos mixed with siGLO (positive transfection indicator) and imaged 3 d after transfection. First frames show areas (boxes) analyzed in control or PKP2-deficient cells, and the three magnified columns show selected vesicles (colored arrows) at three time points. Vesicle trajectories taken from the analyzed area are shown on the right, where colored tracks represent the movement of selected vesicles. Bars, 20 µm. (B) Bar graphs show quantification of distribution of particle movements (equal to instantaneous velocity; for each set of bars **, P < 0.01) and the ratio of rapid movements to the average amount of analyzed particles (10–15 particles per cell) in each cell (three to four cells were analyzed per experiment) for Dsc2 in control and knockdown conditions. In PKP2-deficient cells, the amount of the particle movements as well as the ratio of rapid movements for Dsc2 was dramatically decreased compared with the control cells (**, P < 0.01 for the ratio of rapid movements). (C) Distribution of long vectors and the ratio of long vectors to the average amount of analyzed particles (10–15 particles in each cell) for Dsg2 in cells with PKP2 knockdown are similar to that observed in control cells (P = 0.9). (D) Immunoblot showing level of PKP2 knockdown (∼60%, n = 3; *, P < 0.05) for experiments in A and B. NT, nontargeting; Tub, tubulin.
Figure 9.
Figure 9.
Loss of kinesin-1 or -2 results in weakened cell–cell adhesion. (A) Confluent monolayers of Scc9 keratinocytes after 72-h siRNA transfection with either kinesin-1 (KHC) or kinesin-2 (KIF3A) or doubly silenced for kinesin-1/Dsg2, kinesin-1/Dsc2, kinesin-2/Dsg2, or kinesin-2/Dsc2 were subjected to a dispase mechanical dissociation assay in triplicate. Cells were incubated with dispase enzyme to lift the cells from the dish, and the intact monolayer was subjected to mechanical stress. Increasing amounts of fragments indicate the loss of cell–cell adhesion. (B) Bar graphs show quantification of fragmentation as an average from at least three experiments. ***, P < 0.001 for pairs siKHC/siKHC+siDsc2, siKHC+siDsg2/siKHC+siDsc2, siKIF3A/siKIF3A+siDsg2, and siKIF3A+siDsc2/siKIF3A+siDsg2. P < 0.01 for pairs nontargeting (NT) siRNA/siKHC and nontargeting siRNA/siKIF3A. P < 0.05 for the pair siKHC/siKIF3A. (C) Level of Dsg2 and Dsc2 knockdowns (KD) in dispase experiments shown by Western blots (compiled data from the same blots). Level of knockdown for Dsg2 was ∼70% (*, P < 0.05) and ∼90% for Dsc2 (***, P < 0.001; n = 3 for both). The protein expression levels of the partner desmosomal cadherins and E-cadherin (E-cad) were unchanged. Levels of KHC and KIF3A knockdowns were comparable with that shown in Fig. 2 F and Fig. 5 D. Black lines indicate that intervening lanes have been spliced out. GAPDH, glyceraldehyde 3-phosphate dehydrogenase.
Figure 10.
Figure 10.
Model of Dsg2 and Dsc2 intracellular trafficking to the plasma membrane. Desmosomal cadherins exist in separate intracellular vesicular compartments that are transported using distinct motors. Dsg2-containing vesicles move inside the cell using the kinesin-1 motor protein, whereas kinesin-2, in cooperation with PKP2, is responsible for Dsc2 dynamic behavior. IF, intermediate filament.

References

    1. Aizawa H., Sekine Y., Takemura R., Zhang Z., Nangaku M., Hirokawa N. 1992. Kinesin family in murine central nervous system. J. Cell Biol. 119:1287–1296 10.1083/jcb.119.5.1287 - DOI - PMC - PubMed
    1. Amagai M., Kàrpàti S., Klaus-Kovtun V., Udey M.C., Stanley J.R. 1994. Extracellular domain of pemphigus vulgaris antigen (desmoglein 3) mediates weak homophilic adhesion. J. Invest. Dermatol. 102:402–408 10.1111/1523-1747.ep12372164 - DOI - PubMed
    1. Andersen N.J., Yeaman C. 2010. Sec3-containing exocyst complex is required for desmosome assembly in mammalian epithelial cells. Mol. Biol. Cell. 21:152–164 10.1091/mbc.E09-06-0459 - DOI - PMC - PubMed
    1. Angst B.D., Nilles L.A., Green K.J. 1990. Desmoplakin II expression is not restricted to stratified epithelia. J. Cell Sci. 97:247–257 - PubMed
    1. Bass-Zubek A.E., Hobbs R.P., Amargo E.V., Garcia N.J., Hsieh S.N., Chen X., Wahl J.K., III, Denning M.F., Green K.J. 2008. Plakophilin 2: a critical scaffold for PKCα that regulates intercellular junction assembly. J. Cell Biol. 181:605–613 10.1083/jcb.200712133 - DOI - PMC - PubMed

Publication types