. 2012 Jan 17;109(3):764-9.
doi: 10.1073/pnas.1110069108. Epub 2011 Dec 19.

Collaborative learning in networks

Affiliations

Collaborative learning in networks

Winter Mason et al. Proc Natl Acad Sci U S A. .

Abstract

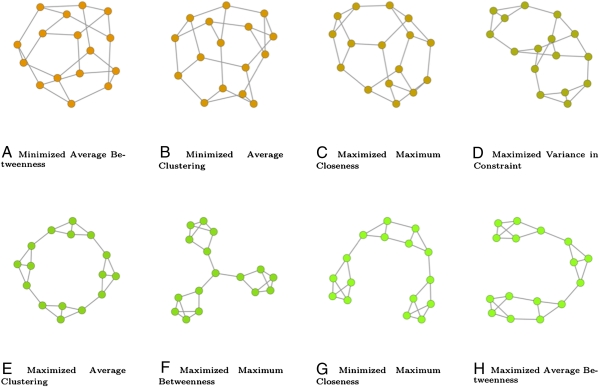
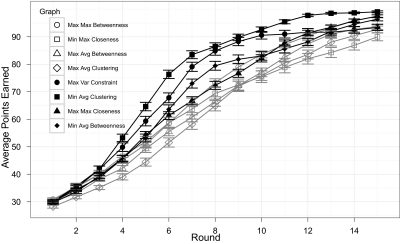
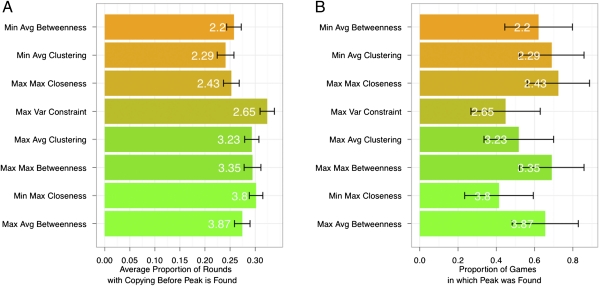
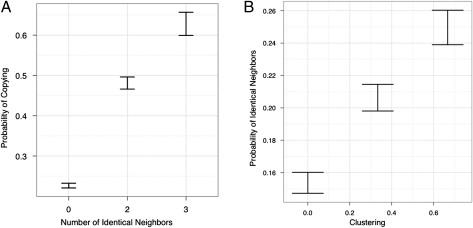
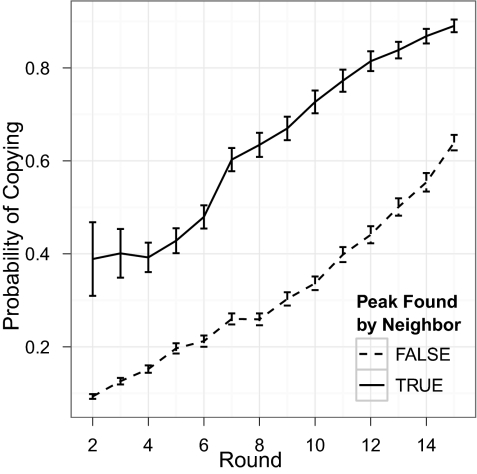
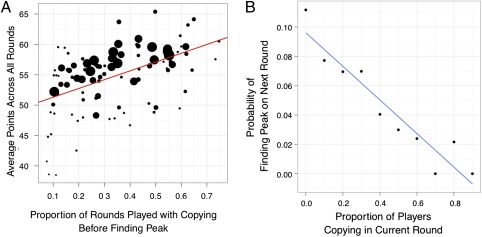
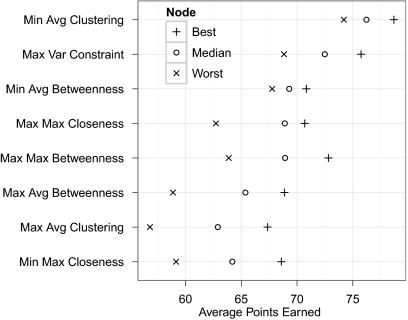
Complex problems in science, business, and engineering typically require some tradeoff between exploitation of known solutions and exploration for novel ones, where, in many cases, information about known solutions can also disseminate among individual problem solvers through formal or informal networks. Prior research on complex problem solving by collectives has found the counterintuitive result that inefficient networks, meaning networks that disseminate information relatively slowly, can perform better than efficient networks for problems that require extended exploration. In this paper, we report on a series of 256 Web-based experiments in which groups of 16 individuals collectively solved a complex problem and shared information through different communication networks. As expected, we found that collective exploration improved average success over independent exploration because good solutions could diffuse through the network. In contrast to prior work, however, we found that efficient networks outperformed inefficient networks, even in a problem space with qualitative properties thought to favor inefficient networks. We explain this result in terms of individual-level explore-exploit decisions, which we find were influenced by the network structure as well as by strategic considerations and the relative payoff between maxima. We conclude by discussing implications for real-world problem solving and possible extensions.


Conflict of interest statement

The authors declare no conflict of interest.

Figures

Fig. 1.
Fig. 1.
Each of the 16-player, fixed-degree (k = 3) graphs used in the experiment, arranged in order of efficiency. The upper row constitutes networks whose decentralized nature connotes high efficiency (short path lengths), whereas the networks in the lower row are all centralized to some degree and also exhibit significant local clustering, both of which lower efficiency. The network on the upper right is an intermediate case, being decentralized but exhibiting some local structure.
Fig. 2.
Fig. 2.
Average points earned by players in the different networks over rounds (error bars are ±1 SE) in sessions where the peak is found. Graphs with high clustering and long path lengths are shown in dark gray; those with low clustering and low path lengths are shown in light gray.
Fig. 3.
Fig. 3.
(A) In contrast to theoretical expectations, less efficient networks displayed a higher tendency to copy; hence, they explored less than more efficient networks [numbers and colors (orange is shorter and green is longer) both indicate clustering coefficient]. (B) Probability of finding the peak is not reliably different between efficient and inefficient networks.
Fig. 4.
Fig. 4.
(A) Probability of copying at least one neighbor's previous position increases with the number of neighbors who occupy identical positions. (B) Higher local clustering is associated with higher probability that an individual's neighbors currently occupy the same position.
Fig. 5.
Fig. 5.
Copying increases as a function of time, regardless of the discovery of the peak.
Fig. 6.
Fig. 6.
(A) Average individual performance increases with individual tendency to copy his or her neighbors’ positions (size of circle indicates the number of games played by a given subject, showing the same trend for frequent and infrequent participants). Larger circles indicate more games, and smaller circles indicate fewer games. (B) Proportion of players copying each other on any given round was associated with diminished probability of discovering the main peak of the fitness landscape on the subsequent round.
Fig. 7.
Fig. 7.
Average points earned for best-positioned node, median node, and worst-positioned node in each of the graph types in sessions in which the peak was found. The decentralized graphs perform the best, and the most successful position in the centralized graphs only does as well as the median node in the decentralized graphs. Avg, average; Max, maximum; Min, minimum; Var, variance.

References

    1. Kauffman SA. The Origins of Order: Self Organization and Selection in evolution. New York: Oxford Univ Press; 1993.
    1. Levinthal DA. Adaptation on rugged landscapes. Manage Sci. 1997;43:934–950.
    1. March JG. Exploration and exploitation in organizational learning. Organ Sci. 1991;2:71–87.
    1. Gupta AK, Smith KG, Shalley CE. The interplay between exploration and exploitation. Acad Manage J. 2006;49:693–706.
    1. Bavelas A. Communication patterns in task-oriented groups. J Acoust Soc Am. 1950;22:725–730.