. 2012 Jan 10;109(2):594-9.
doi: 10.1073/pnas.1116053109. Epub 2011 Dec 19.

Metagenomic systems biology of the human gut microbiome reveals topological shifts associated with obesity and inflammatory bowel disease

Affiliations

Metagenomic systems biology of the human gut microbiome reveals topological shifts associated with obesity and inflammatory bowel disease

Sharon Greenblum et al. Proc Natl Acad Sci U S A. .

Abstract

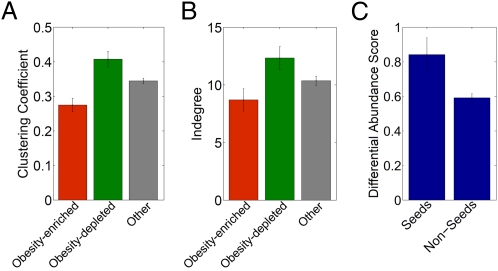
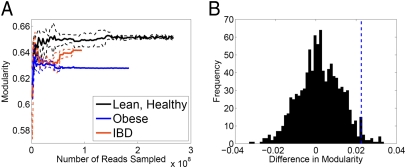
The human microbiome plays a key role in a wide range of host-related processes and has a profound effect on human health. Comparative analyses of the human microbiome have revealed substantial variation in species and gene composition associated with a variety of disease states but may fall short of providing a comprehensive understanding of the impact of this variation on the community and on the host. Here, we introduce a metagenomic systems biology computational framework, integrating metagenomic data with an in silico systems-level analysis of metabolic networks. Focusing on the gut microbiome, we analyze fecal metagenomic data from 124 unrelated individuals, as well as six monozygotic twin pairs and their mothers, and generate community-level metabolic networks of the microbiome. Placing variations in gene abundance in the context of these networks, we identify both gene-level and network-level topological differences associated with obesity and inflammatory bowel disease (IBD). We show that genes associated with either of these host states tend to be located at the periphery of the metabolic network and are enriched for topologically derived metabolic "inputs." These findings may indicate that lean and obese microbiomes differ primarily in their interface with the host and in the way they interact with host metabolism. We further demonstrate that obese microbiomes are less modular, a hallmark of adaptation to low-diversity environments. We additionally link these topological variations to community species composition. The system-level approach presented here lays the foundation for a unique framework for studying the human microbiome, its organization, and its impact on human health.


Conflict of interest statement

The authors declare no conflict of interest.

Figures

Fig. 1.
Fig. 1.
(A) Mean and SE of the centrality scores of obesity-associated enzymes vs. all other enzymes in the network. Obesity-associated enzymes are further divided into enzymes that are enriched or depleted in obese microbiomes. (B) Proportion of enzymes that are associated with obesity (main plot) and IBD (Inset) within three equally populated centrality-based network tiers. Each concentrical pie chart depicts the percent of enzymes within a specific centrality tier that are classified as enriched or depleted. Enzymes associated with obesity or IBD are found in significantly higher proportions in the peripheral tier (P < 5.6 × 10⁻⁶ [obesity], P < 4.8 × 10⁻⁵ [IBD]; Hypergeometric enrichment test). This result still holds considering alternative or stricter criteria for association with the host state (SI Appendix).
Fig. 2.
Fig. 2.
Mean and SE of the clustering coefficient (A) and in-degree (B) of enriched (red; n = 170), depleted (green; n = 180), and other (gray; n = 1213) enzymes in obese microbiomes. Clustering coefficient is defined as the ratio between the total number of edges connecting a node's neighbors and the potential number of edges that could exist between them. In-degree denotes the number of edges terminating at a node. (C) Mean and SE of the differential abundance scores of seeds vs. non-seed enzymes.
Fig. 3.
Fig. 3.
Modularity of host state-specific metabolic networks. (A) Rarefaction analysis of the modularity of pooled lean-healthy, obese-healthy, and IBD-lean microbiomes. The plot depicts the mean (solid lines) and SD (dotted lines) of five rounds of rarefaction analysis, obtained by calculating the modularity of networks derived from progressively smaller randomly selected sets of reads. (B) Difference between the modularity of the obese-specific and lean-healthy–specific network is plotted (dashed blue line) against a null distribution of differences obtained via random grouping of samples (more details are provided in SI Appendix). The observed difference in modularity is significantly greater than the expected difference according to this null distribution.

References

    1. Ley RE, Peterson DA, Gordon JI. Ecological and evolutionary forces shaping microbial diversity in the human intestine. Cell. 2006;124:837–848. - PubMed
    1. Dethlefsen L, McFall-Ngai M, Relman DA. An ecological and evolutionary perspective on human-microbe mutualism and disease. Nature. 2007;449:811–818. - PMC - PubMed
    1. Qin J, et al. MetaHIT Consortium A human gut microbial gene catalogue established by metagenomic sequencing. Nature. 2010;464:59–65. - PMC - PubMed
    1. Turnbaugh PJ, et al. The human microbiome project. Nature. 2007;449:804–810. - PMC - PubMed
    1. Turnbaugh PJ, et al. An obesity-associated gut microbiome with increased capacity for energy harvest. Nature. 2006;444:1027–1031. - PubMed

Publication types