

Steric volume exclusion sets soluble protein concentrations in photoreceptor sensory cilia
- PMID: 22184246
- PMCID: PMC3252922
- DOI: 10.1073/pnas.1115109109
Steric volume exclusion sets soluble protein concentrations in photoreceptor sensory cilia
Abstract
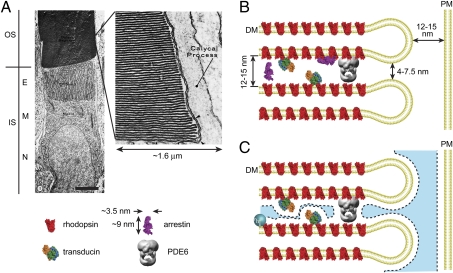
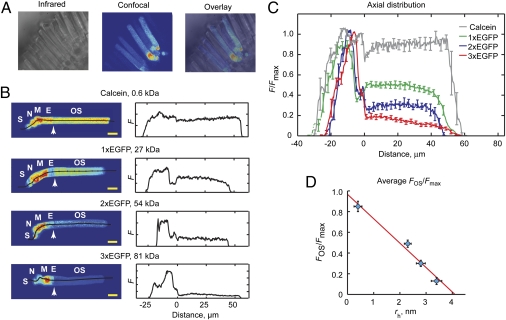
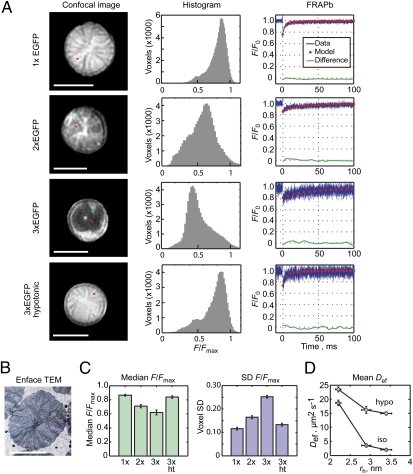
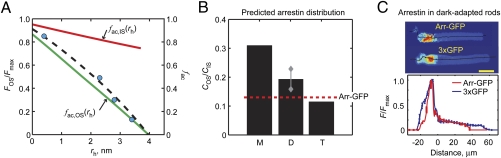
Proteins segregate into discrete subcellular compartments via a variety of mechanisms, including motor protein transport, local binding, and diffusion barriers. This physical separation of cell functions serves, in part, as a mechanism for controlling compartment activity by allowing regulation of local protein concentrations. In this study we explored how soluble protein size impacts access to the confined space within the retinal photoreceptor outer segment signaling compartment and discovered a strikingly steep relationship. We find that GFP monomers, dimers, and trimers expressed transgenically in frog rods are present in the outer segment at 1.8-, 2.9-, and 6.8-fold lower abundances, relative to the cell body, than the small soluble fluorescent marker, calcein. Theoretical analysis, based on statistical-mechanical models of molecular access to polymer meshes, shows that these observations can be explained by the steric hindrance of molecules occupying the highly constrained spaces between outer segment disc membranes. This mechanism may answer a long-standing question of how the soluble regulatory protein, arrestin, is effectively excluded from the outer segments of dark-adapted rods and cones. Generally, our results suggest an alternate mode for the control of protein access to cell domains based on dynamic, size-dependent compartmental partitioning that does not require diffusion barriers, active transport, or large numbers of immobile binding sites.
Conflict of interest statement
The authors declare no conflict of interest.
Figures
Similar articles
-
Quantification of the cytoplasmic spaces of living cells with EGFP reveals arrestin-EGFP to be in disequilibrium in dark adapted rod photoreceptors.J Cell Sci. 2004 Jun 15;117(Pt 14):3049-59. doi: 10.1242/jcs.01167. J Cell Sci. 2004. PMID: 15197244
-
Diffusion of a soluble protein, photoactivatable GFP, through a sensory cilium.J Gen Physiol. 2010 Mar;135(3):173-96. doi: 10.1085/jgp.200910322. J Gen Physiol. 2010. PMID: 20176852 Free PMC article.
-
Cytoskeleton participation in subcellular trafficking of signal transduction proteins in rod photoreceptor cells.J Neurosci Res. 2002 Feb 1;67(3):290-7. doi: 10.1002/jnr.10120. J Neurosci Res. 2002. PMID: 11813233
-
Tuning outer segment Ca2+ homeostasis to phototransduction in rods and cones.Adv Exp Med Biol. 2002;514:179-203. doi: 10.1007/978-1-4615-0121-3_11. Adv Exp Med Biol. 2002. PMID: 12596922 Review.
-
Protein networks and complexes in photoreceptor cilia.Subcell Biochem. 2007;43:209-35. doi: 10.1007/978-1-4020-5943-8_10. Subcell Biochem. 2007. PMID: 17953396 Review.
Cited by
-
Redox proteomic identification of visual arrestin dimerization in photoreceptor degeneration after photic injury.Invest Ophthalmol Vis Sci. 2012 Jun 26;53(7):3990-8. doi: 10.1167/iovs.11-9321. Invest Ophthalmol Vis Sci. 2012. PMID: 22599583 Free PMC article.
-
On the Wrong Track: Alterations of Ciliary Transport in Inherited Retinal Dystrophies.Front Cell Dev Biol. 2021 Mar 5;9:623734. doi: 10.3389/fcell.2021.623734. eCollection 2021. Front Cell Dev Biol. 2021. PMID: 33748110 Free PMC article. Review.
-
Photoreceptor outer segment as a sink for membrane proteins: hypothesis and implications in retinal ciliopathies.Hum Mol Genet. 2017 Aug 1;26(R1):R75-R82. doi: 10.1093/hmg/ddx163. Hum Mol Genet. 2017. PMID: 28453661 Free PMC article. Review.
-
Primary cilia: Cell and molecular mechanosensors directing whole tissue function.Semin Cell Dev Biol. 2017 Nov;71:42-52. doi: 10.1016/j.semcdb.2017.08.036. Epub 2017 Aug 24. Semin Cell Dev Biol. 2017. PMID: 28843978 Free PMC article. Review.
-
Analysis of soluble protein entry into primary cilia using semipermeabilized cells.Methods Cell Biol. 2015;127:203-21. doi: 10.1016/bs.mcb.2014.12.006. Epub 2015 Feb 14. Methods Cell Biol. 2015. PMID: 25837393 Free PMC article.
References
-
- Pedersen LB, Rosenbaum JL. Intraflagellar transport (IFT) role in ciliary assembly, resorption and signalling. Curr Top Dev Biol. 2008;85:23–61. - PubMed
-
- Calvert PD, Strissel KJ, Schiesser WE, Pugh EN, Jr, Arshavsky VY. Light-driven translocation of signaling proteins in vertebrate photoreceptors. Trends Cell Biol. 2006;16:560–568. - PubMed
Publication types
MeSH terms
Substances
Grants and funding
LinkOut - more resources
Full Text Sources
