. 2012 Jan 10;109(2):E42-50.
doi: 10.1073/pnas.1108229109. Epub 2011 Dec 19.

Gene order and chromosome dynamics coordinate spatiotemporal gene expression during the bacterial growth cycle

Affiliations

Gene order and chromosome dynamics coordinate spatiotemporal gene expression during the bacterial growth cycle

Patrick Sobetzko et al. Proc Natl Acad Sci U S A. .

Abstract

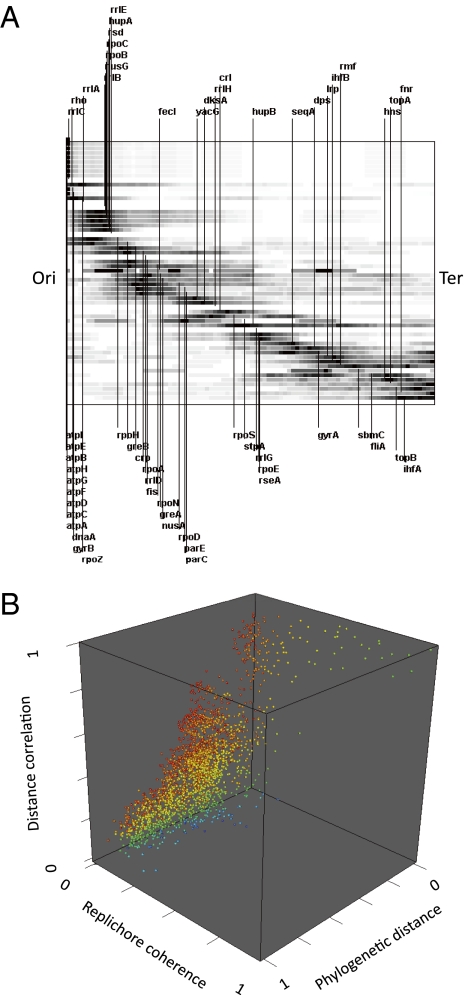
In Escherichia coli crosstalk between DNA supercoiling, nucleoid-associated proteins and major RNA polymerase σ initiation factors regulates growth phase-dependent gene transcription. We show that the highly conserved spatial ordering of relevant genes along the chromosomal replichores largely corresponds both to their temporal expression patterns during growth and to an inferred gradient of DNA superhelical density from the origin to the terminus. Genes implicated in similar functions are related mainly in trans across the chromosomal replichores, whereas DNA-binding transcriptional regulators interact predominantly with targets in cis along the replichores. We also demonstrate that macrodomains (the individual structural partitions of the chromosome) are regulated differently. We infer that spatial and temporal variation of DNA superhelicity during the growth cycle coordinates oxygen and nutrient availability with global chromosome structure, thus providing a mechanistic insight into how the organization of a complete bacterial chromosome encodes a spatiotemporal program integrating DNA replication and global gene expression.


Conflict of interest statement

The authors declare no conflict of interest.

Figures

Fig. 1.
Fig. 1.
Spatiotemporal organization of chromosomal expression. (A) Temporal changes of NAPs, RNAP composition, and average plasmid DNA superhelicity (σ) during bacterial growth. The phases of growth cycle are correlated with preferred expression of particular NAPs, RNAP holoenzymes and the supercoiling temporal gradient are indicated below. A transient increase in guanosine tetraphosphate (ppGpp) levels occurs at the transition between the exponential and stationary phases. (B) Spatial ordering of regulatory genes on the E. coli chromosome along the OriC–Ter axis. (Top line) Correspondence of macrodomains defined by Valens et al. (40) to linear map. (First bar) Selected genes involved in aerobic/anaerobic metabolism (dark blue), DNA replication (orange), rrn genes (red), and transition phase (brown). Genes on the clockwise (right) replichore are above the bar, and genes on anti-clockwise (left) replichore are below the bar. The atp operon encodes ATP synthase. arcA/arcB encode a two-component system active under microaerobic conditions (61, 62). ArcA also represses rpoS (63). fnr has a dominant role under more strictly anaerobic conditions (61). dnaA, encoding the principal initiator of DNA replication, maps close to OriC, whereas seqA, an inhibitor of replication initiation at OriC, maps closer to Ter. rmf decreases the availability of ribosomes and maps to a macrodomain immediately adjacent to the Ter macrodomain. (Second bar) Selected genes involved in control of DNA topology. gyrB, a component of DNA gyrase responsible for increasing negative superhelicity, maps close to OriC, whereas the gyrase inhibitor susceptibility to B17 microcin, locus C (sbmC), and topA and topB, both responsible for relaxing DNA, map either close to or within the Ter macrodomain. DNA gyrase inhibitor (yacG), encoding an inhibitor of GyrB, maps close to the center. Chromosomal partition genes C and E (parC and parE) encode the subunits of topoisomerase IV, responsible for decatenation of newly replicated DNA in the terminal region (64) and relaxation of negative supercoils (65). (Third bar) Selected genes encoding NAPs. The NAP-encoding gene closest to OriC is hupA, encoding histone-like protein from E. coli strain U93 (HU)α. Its early expression relative to hupB, encoding Huβ (9), could buffer high negative superhelicity generated by DNA gyrase (36). HUα2 and HUαβ, but not HUβ2, constrain high superhelical densities in vitro (9). A mutation in hupA both increases growth rate and antagonizes histone-like nucleoid-structuring protein (H-NS) regulation of certain transcription units (6). High frequency of recombination (Hfq) is a nucleic acid-binding protein whose major role is that of an RNA chaperone, but it also may act as a DNA-binding NAP (8). lrp is activated by ppGpp (38). (Fourth bar) Selected genes involved in modulating RNAP activity, including σ factor-utilization regulators, secondary channel-binding proteins, termination/elongation factors, and RNAP subunits. σ factor-utilization regulators (light green): ω subunit of RNA polymerase (rpoZ), mapping close to the origin, encodes the ω subunit of RNAP, which confers a preference for utilization of σ70 (28). Regulator of sigma D (rsd) encodes an anti-σ70 (66), whereas crl confers a strong preference for σS utilization (67). Note that both rpoZ and crl map closer to OriC than do the respective σ factors whose activity they affect. The encoded regulatory pattern thus reflects a shift from predominantly σ70 use close to OriC to σS availability in the central region of the chromosome. Secondary channel-binding proteins (plum): growth regulator A and B, transcription elongation factors (greA and greB) both map in the region containing many genes expressed during rapid growth. GreA has been shown to stimulate initiation and transcription of genes involved in aerobic metabolism, including the atp operon (68, 69) as well as the rrnB P1 promoter in vitro (, but also see ref. 71). DksA, like the plasmid-encoded quorum sensing regulator (TraR) protein (72), inhibits ribosomal protein promoters and rrn initiation (73, 74) and is more distant from OriC than is greA. In vivo it would act to reduce the rate of rrn initiation and hence antagonize transcription foci formation. Termination/elongation factors (red): The termination factor Rho is encoded by a gene located very close to OriC. This location may compensate for the antagonistic effect of high negative superhelicity on transcription termination, which involves the rewinding of DNA. RNAP subunits: The map positions relative to OriC of rpoD and rpoS, respectively encoding σ70 and σS, correspond to their relative order of temporal expression.
Fig. 2.
Fig. 2.
Arrangement of important regulatory elements according to their position relative to OriC in the γ-Proteobacteria. (A) Genes located on the right and left replichores are indicated above and below the chart, respectively, as in Fig.1B. Horizontal bars show spatial distributions of orthologs; black color indicates the highest density for each individual distribution. The plot shows a strong conservation of chromosomal positions suggesting that origin-focused gene positioning is a major selection criterion in γ-Proteobacteria. (B) Relationship among the phylogenetic distance, the correlation of distance to origin, and the replichore coherence (the conserved replichore identity of orthologs) for all γ-Proteobacteria. The points represent the data on pair-wise species comparisons computed using the Pearson correlation coefficient of either distances to origin or replichore identity (right/left) of all orthologous pairs. The points are color-coded in the 3D plot. Red indicates a higher correlation of distance to origin than replichore coherence; blue indicates higher replichore coherence. The predominance of red points indicates the stronger conservation of distance to origin. The phylogenetic distances in B were derived from the tree of γ-Proteobacteria (http://www.cbrg.ethz.ch/research/orthologous/speciestrees).
Fig. 3.
Fig. 3.
Organization of binding sites for the major σ initiation factors, DNA, gyrase, and NAPs in the chromosome (RegulonDB). Distributions were calculated by using a sliding window of 400 kb and normalizing over the total gene number for each window. The replichores are organized from OriC to Ter (left to right). The frequency distributions (ordinate) are plotted above the zero in the ordinate for the right replichore and below the zero for the left replichore. (A) Genomic distributions for RNAPσ70-regulated promoters. (B) Genomic distributions for σS-regulated promoters. (C) Genomic distributions of gyrase-binding sites. (D) Inferred gradient of negative superhelical density along the OriC–Ter axis in exponentially growing cells. (E) Genomic distribution of FIS-binding sites. (F) Genomic distribution of IHF-binding sites. (G) Genomic distribution of H-NS–binding sites. (H) Genomic distribution of LRP-binding sites. The chromosomal position for each regulator gene is indicated, and the direction of the effect is rainbow color-coded with blue for repression and red for activation. The Ori, Ter, left, and right macrodomains (green, cyan, blue, and red lines, respectively) are indicated on the chromosomal replichores above and below the distributions.
Fig. 4.
Fig. 4.
Organization of functional groups and regulatory communications in the E. coli chromosome. (A) maGOGs. (B) TRN. (C) Couplons. (D) HEN. The circular genome is represented as a pair of multicolored parallel lines corresponding to the right (Upper line) and left (Lower line) replichores. On the replichores the macrodomains (colored as in Fig. 3) and the rrn functional domain (orange dashed line) are indicated. All trans communications occur between the upper and lower lines, whereas cis communications occur along the lines. The order of regulatory genes on the right and left replichores is indicated above and below each network, respectively, organized from OriC to Ter.
Fig. 5.
Fig. 5.
Spatiotemporal HEN patterns. The circular genome is represented as a pair of thin parallel lines corresponding to the right (Upper line) and left (Lower line) replichores as in Fig. 4. Macrodomains are indicated in color on the right (Upper) and left (Lower) replichores organized from OriC to Ter. (A) Effective HEN (eHEN) pattern of exponentially growing wild-type cells. (B) eHEN pattern of transcripts from stationary wild-type cells. Red indicates coherently enhanced and blue indicates coherently reduced numbers of expressed genes in matching windows; black indicates an absence of coherence. Note the switch in the activation of the OriC and Ter ends of the chromosome at the transition from exponential to stationary growth. (C) eHEN pattern of rpoS cells lacking σS obtained during exponential phase. (D) eHEN pattern of rpoS cells in stationary phase. Note the spatiotemporal inversion of the activation of the OriC and Ter ends of the chromosome with respect to wild-type cells. (E) eHEN pattern of exponentially growing rpoZ cells favoring EσS. (F) As in E, but the cells were overproducing σ70 from an episome (28). Note the σ70-dependent coherent activation and repression of communications in the OriC and Ter ends of the chromosome, respectively. (G and H) eHEN patterns of wild-type cells grown under conditions of high and low superhelicity, respectively. (I and J) Patterns of hns-mutant cells grown under conditions of high and low superhelicity, respectively. Note the supercoiling-dependent coherent activation and repression of communications in the left and right replichores, respectively. (K and L) eHEN patterns of fis-mutant cells grown under conditions of high and low superhelicity, respectively. Note the coherent activation of distinct supercoiling-dependent cis and trans communications. In AD the cells were grown in minimal medium. In EL the cells were harvested during exponential growth in rich double-YT medium. (M and N) Model of chromosomal morphology changing with DNA superhelicity and NAP gradients on transition from exponential (M) to stationary (N) growth. For clarity, only the interactions between the gradients of FIS (pink) and H-NS (blue) are shown. Although FIS levels decline dramatically on transition to stationary phase, the compaction of the nucleoid along the OriC–Ter axis enables H-NS to establish repression. The chromosome is depicted as a plectoneme, but the model is equally consistent with a toroidal scaffold, which would maintain the separation of the replichores (49, 50). The macrodomains are indicated by colors, and approximate chromosomal positions of the fis and hns genes are shown. The expression data for mapping onto the HEN connectivity patterns were taken from Dong and Schellhorn (59) in AD, from Geertz et al. (28) in E and F, and from Blot et al. (16) in GL.
Fig. P1.
Fig. P1.
Spatiotemporal chromosome expression. (A) Order of selected regulatory genes on the circular E. coli chromosome, colored according to their temporal expression pattern. Red, early exponential phase; orange, ribosomal RNA operons (transferring the genetic DNA code to protein expression); yellow, mid- to late exponential phase; green, transition to stationary phase; blue, genes functional in both exponential and stationary phases. The macrodomains, (Ori, NSR, Right, Ter, Left, and NSL) are indicated by colors. The inner circle illustrates the frequency distribution of gyrase-binding sites (red for maximum and blue for minimum frequency). (B) Dynamic gene expression pattern of growing E. coli cells. Red and blue connections indicate spatiotemporally coordinated activation during exponential and stationary growth phases, respectively.

Similar articles

Cited by

References

    1. Balke VL, Gralla JD. Changes in the linking number of supercoiled DNA accompany growth transitions in Escherichia coli. J Bacteriol. 1987;169:4499–4506. - PMC - PubMed
    1. Hsieh LS, Burger RM, Drlica K. Bacterial DNA supercoiling and [ATP]/[ADP]. Changes associated with a transition to anaerobic growth. J Mol Biol. 1991;219:443–450. - PubMed
    1. Bordes P, et al. DNA supercoiling contributes to disconnect sigmaS accumulation from sigmaS-dependent transcription in Escherichia coli. Mol Microbiol. 2003;48:561–571. - PubMed
    1. Ohniwa RL, et al. Dynamic state of DNA topology is essential for genome condensation in bacteria. EMBO J. 2006;25:5591–5602. - PMC - PubMed
    1. Rimsky S, Travers A. Pervasive regulation of nucleoid structure and function by nucleoid-associated proteins. Curr Opin Microbiol. 2011;14:136–141. - PubMed

Publication types

MeSH terms