. 2011 Dec 15;17(24):7704-11.
doi: 10.1158/1078-0432.CCR-11-2049.

Chromosomal instability substantiates poor prognosis in patients with diffuse large B-cell lymphoma

Affiliations

Chromosomal instability substantiates poor prognosis in patients with diffuse large B-cell lymphoma

Samuel F Bakhoum et al. Clin Cancer Res. .

Abstract

Purpose: The specific role of chromosomal instability (CIN) in tumorigenesis has been a matter of conjecture. In part, this is due to the challenge of directly observing chromosome mis-segregation events as well as the inability to distinguish the role of CIN, which consists of increased rates of chromosome mis-segregation, from that of aneuploidy, which is a state of nondiploid chromosome number.

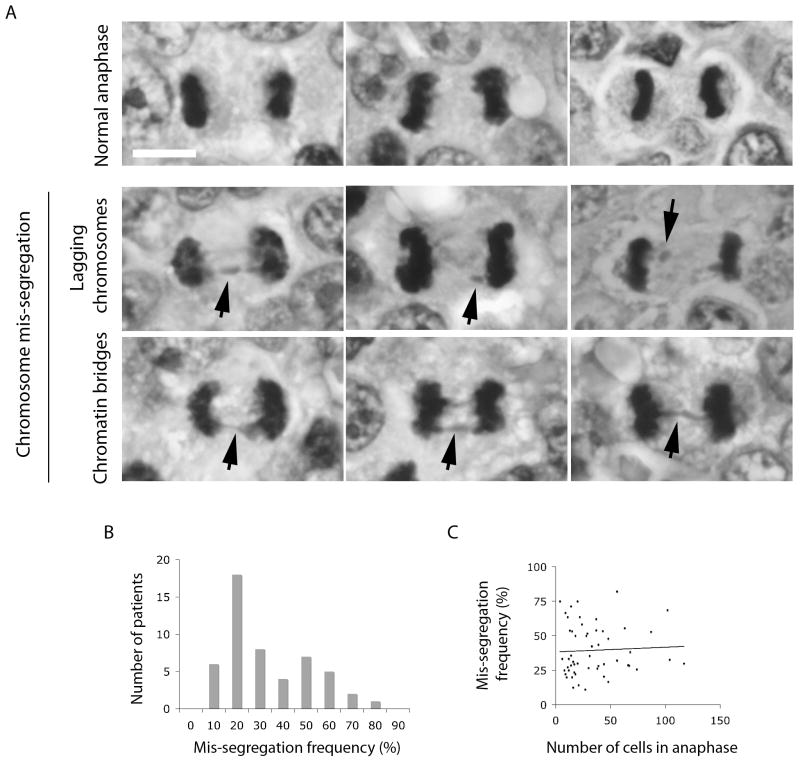
Experimental design: Here, we examine the contribution of CIN to the prognosis of patients diagnosed with diffuse large B-cell lymphoma (DLBCL) by directly surveying tumor cells, fixed while undergoing anaphase, for evidence of chromosome mis-segregation. Hematoxylin and eosin-stained samples from a cohort of 54 patients were used to examine the relationship between frequencies of chromosome mis-segregation and patient prognosis, overall survival, and response to treatment.

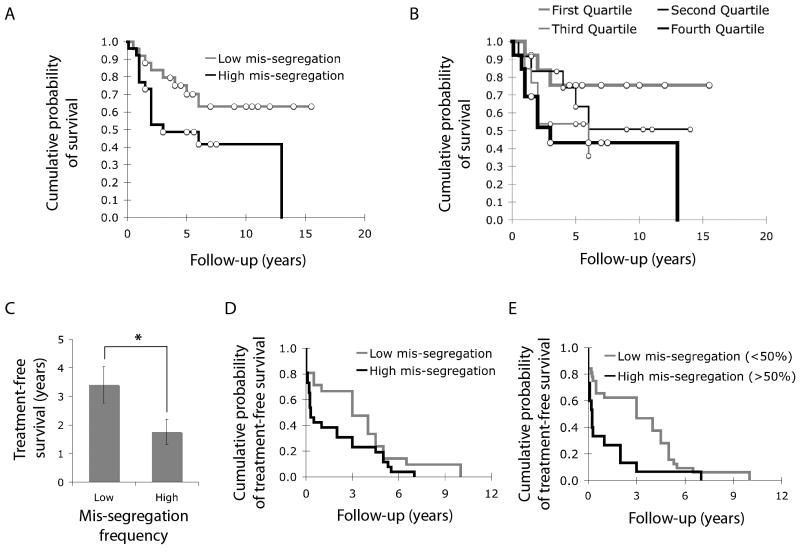
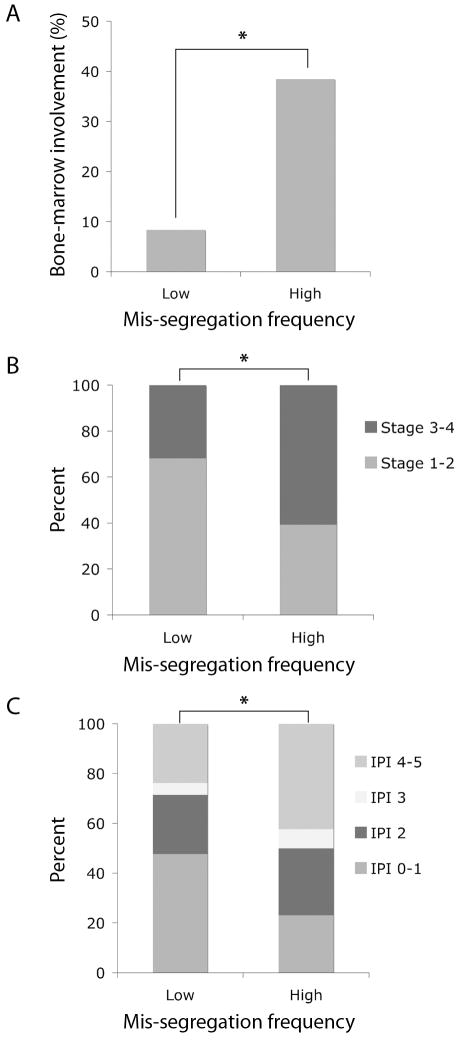
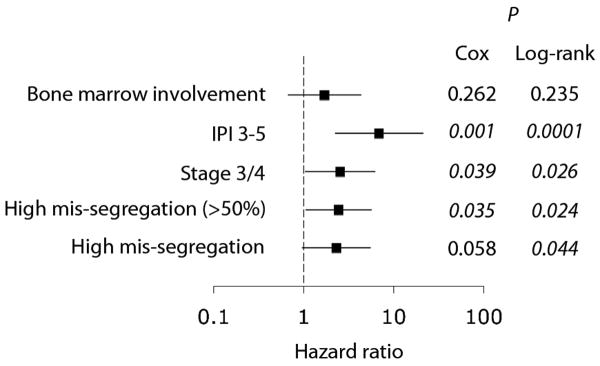
Results: We show that a two-fold increase in the frequency of chromosome mis-segregation led to a 24% decrease in overall survival and 48% decrease in relapse-free survival after treatment. The HR of death in patients with increased chromosome mis-segregation was 2.31 and these patients were more likely to present with higher tumor stage, exhibit tumor bone marrow involvement, and receive a higher International Prognostic Index score.

Conclusions: Increased rates of chromosome mis-segregation in DLBCL substantiate inferior outcome and poor prognosis. This is likely due to increased heterogeneity of tumor cells leading to a larger predilection for adaptation in response to external pressures such as metastasis and drug treatments. We propose that targeting CIN would yield superior prognosis and improved response to chemotherapeutic drugs.


Conflict of interest statement

Disclosure of potential conflict of interest: Authors claim no potential conflicts of interest

Figures

Figure 1
Figure 1
A, images of H&E stained samples showing cells during anaphase. Examples of normal anaphase, anaphase with lagging chromosomes and chromatin bridges (black arrows) are shown. Scale bar, 5-μm. B, histogram showing the distribution of patient samples based on frequency of anaphase cells which exhibit evidence of chromosome mis-segregation. C, Black circles depict the relationship between the number of anaphase cells and frequencies of chromosome mis-segregation observed in specimens taken from individual patients. Black line represents the linear trend, R2 = 0.0026.
Figure 2
Figure 2
A, Kaplan-Meier DSS analysis comparing the overall survival probability of patients with low (n = 25) and high (n = 26) chromosome mis-segregation, where median survival time was 8.76 ± 1.01 and 6.62 ± 1.18 years for low and high frequencies of mis-segregation groups, respectively. P < 0.05. White circles denote censored data. B, Kaplan-Meier DSS analysis comparing the overall survival probability of patients in the lowest (n = 13, thick grey line), second (n = 12, thin black line), third (n = 13, thin grey line) and highest (n = 13, thick black line) quartiles of chromosome mis-segregation frequencies. Statistical significance was achieved only when comparing lowest and highest quartiles where median survival time was 8.05 ± 1.21 and 6.45 ± 1.77 years for low and high mis-segregation groups, respectively. P < 0.05. White circles denote censored data. C, years of treatment-free survival for patients with low and high frequencies of chromosome mis-segregation. Bars represent mean ± s.e.m.. *, p < 0.05, t-test, n = 47 patients. D, Kaplan-Meier DSS analysis comparing treatment-free survival probability of patients with low (n = 21) and high (n = 26) frequencies of chromosome mis-segregation, where median treatment-free survival time was 3.41 ± 0.65 and 1.76 ± 0.44 years for low and high mis-segregation groups, respectively. P = 0.08. E, Kaplan-Meier DSS analysis comparing treatment-free survival probability of patients with low (n = 32) and high (n = 15) frequencies of chromosome mis-segregation categorized based on a chromosome mis-segregation frequency of 50%, where median treatment-free survival time was 3.16 ± 0.49 and 1.08 ± 0.49 years for low and high mis-segregation groups, respectively. P < 0.01.
Figure 3
Figure 3
A, the percentage of patients with tumor bone marrow involvement in groups with low and high frequencies of chromosome mis-segregation. *, p < 0.05, Pearson's χ2-test, n = 24 and 26 for low and high mis-segregation groups, respectively. B, the percentage of patients stratified based on their tumor stage upon diagnosis and with respect to frequencies of chromosome mis-segregation. *, p < 0.05, Pearson's χ2-test, n = 22 and 28 for low and high mis-segregation groups, respectively. C, the percentage of patients stratified based on their IPI score upon diagnosis and with respect to frequencies of chromosome mis-segregation. *, p < 0.001, Pearson's χ2-test, n = 21 and 26 for low and high mis-segregation groups, respectively.
Figure 4
Figure 4
Forest plot showing hazard ratio for death with respects to patients with high frequencies of chromosome mis-segregation, tumor stage 3/4, IPI score 3-5, and positive tumor bone marrow involvement when compared with low frequencies of chromosome mis-segregation, tumor stage 1/2, IPI score 0-2, and negative tumor bone marrow involvement, respectively.

References

    1. Cimini D. Merotelic kinetochore orientation, aneuploidy, and cancer. Biochim Biophys Acta. 2008;1786:32–40. - PubMed
    1. Lengauer C, Kinzler KW, Vogelstein B. Genetic instability in colorectal cancers. Nature. 1997;386:623–7. - PubMed
    1. Lengauer C, Kinzler KW, Vogelstein B. Genetic instabilities in human cancers. Nature. 1998;396:643–9. - PubMed
    1. Chung DC, Pino MS. The Chromosomal Instability Pathway in Colon Cancer. Gastroenterology. 2010;138:2059–72. - PMC - PubMed
    1. Lingle WL, Lukasiewicz K, Salisbury JL. Deregulation of the centrosome cycle and the origin of chromosomal instability in cancer. Genome Instability in Cancer Development. 2005;570:393–421. - PubMed

Publication types