. 2012 Jan 16;209(1):157-71.
doi: 10.1084/jem.20101354. Epub 2011 Dec 19.

High-mobility group nucleosome-binding protein 1 acts as an alarmin and is critical for lipopolysaccharide-induced immune responses

Affiliations

High-mobility group nucleosome-binding protein 1 acts as an alarmin and is critical for lipopolysaccharide-induced immune responses

De Yang et al. J Exp Med. .

Abstract

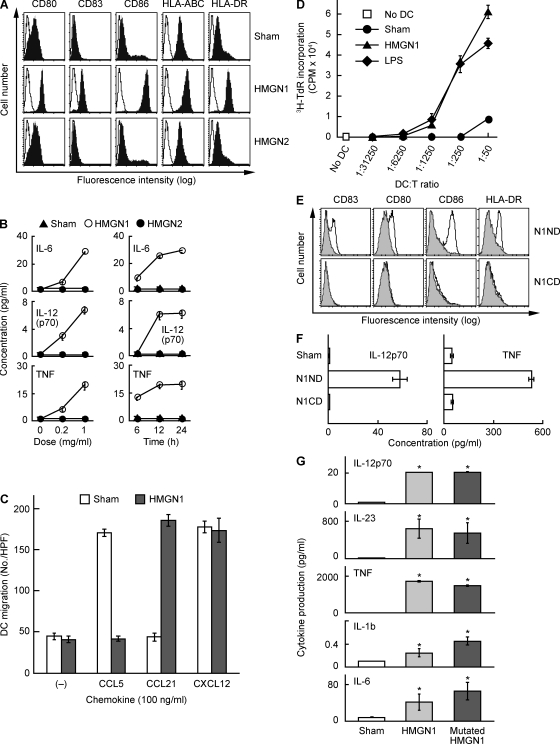
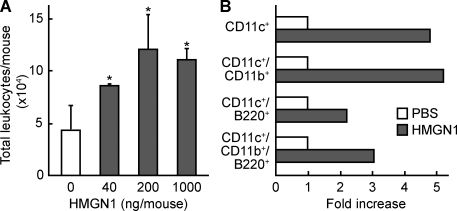
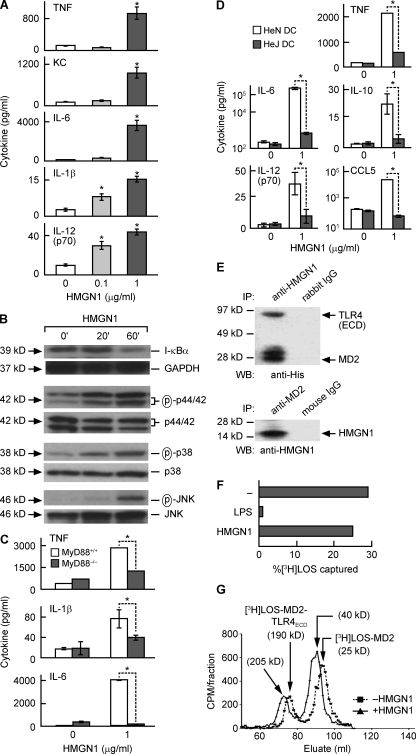
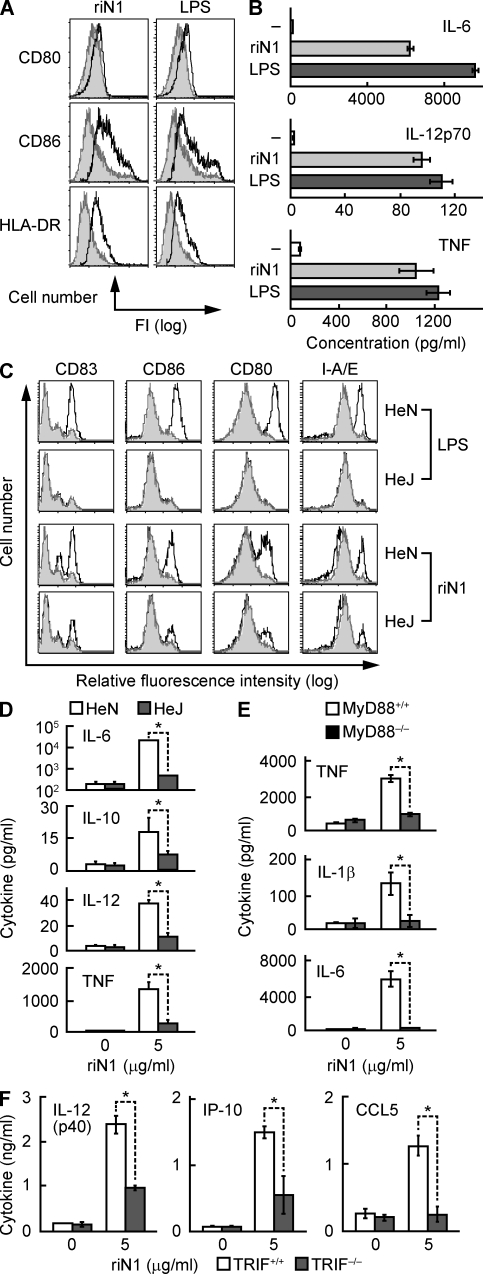
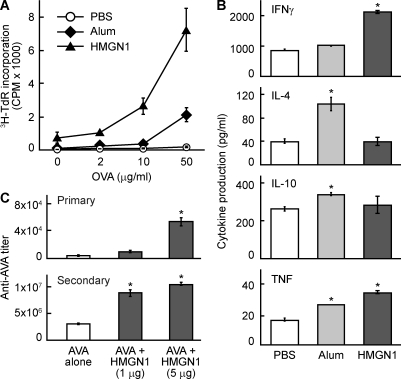
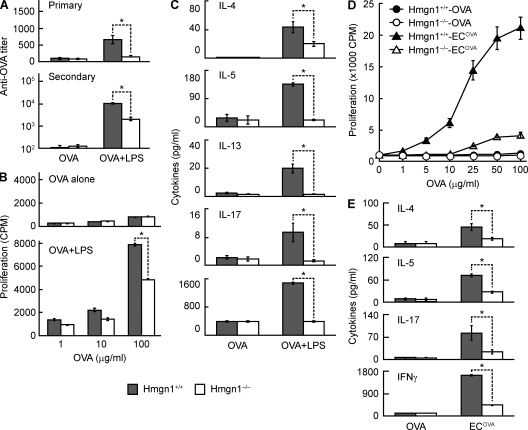
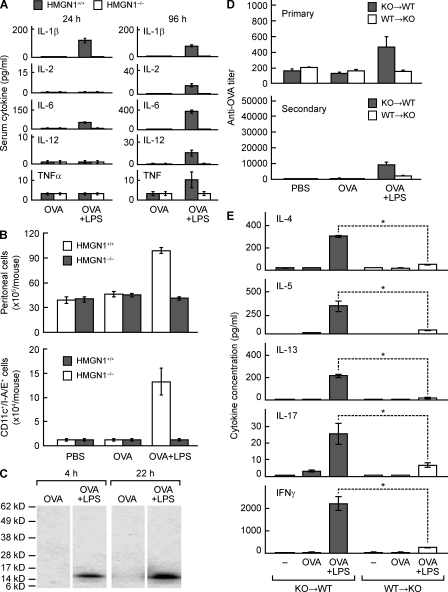
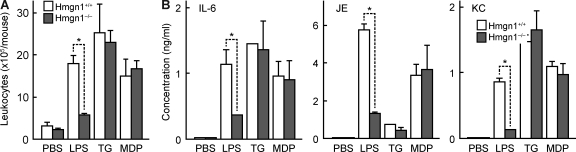
Alarmins are endogenous mediators capable of promoting the recruitment and activation of antigen-presenting cells (APCs), including dendritic cells (DCs), that can potentially alert host defense against danger signals. However, the relevance of alarmins to the induction of adaptive immune responses remains to be demonstrated. In this study, we report the identification of HMGN1 (high-mobility group nucleosome-binding protein 1) as a novel alarmin and demonstrate that it contributes to the induction of antigen-specific immune responses. HMGN1 induced DC maturation via TLR4 (Toll-like receptor 4), recruitment of APCs at sites of injection, and activation of NF-κB and multiple mitogen-activated protein kinases in DCs. HMGN1 promoted antigen-specific immune response upon co-administration with antigens, and Hmgn1(-/-) mice developed greatly reduced antigen-specific antibody and T cell responses when immunized with antigens in the presence of lipopolysaccharide (LPS). The impaired ability of Hmgn1(-/-) mice to mount antigen-specific immune responses was accompanied by both deficient DC recruitment at sites of immunization and reduced production of inflammatory cytokines. Bone marrow chimera experiments revealed that HMGN1 derived from nonleukocytes was critical for the induction of antigen-specific antibody and T cell responses. Thus, extracellular HMGN1 acts as a novel alarmin critical for LPS-induced development of innate and adaptive immune responses.


Figures

Figure 1.
Figure 1.
HMGN1 induces phenotypic and functional maturation of DCs. (A) Human MoDCs were incubated at 5 × 10⁵/ml in the absence (sham) or presence of recombinant HMGN1 or HMGN2 (both at a final concentration of 1 µg/ml) for 48 h before they were immunostained and analyzed by flow cytometry for the expression of the indicated surface molecules (open area, isotype-matched control). Shown are the results of one experiment representative of five. (B) Human MoDCs were incubated at 5 × 10⁵/ml in the absence (sham) or presence of recombinant HMGN1 or HMGN2 at the indicated doses for 24 h (left) or at 1 µg/ml for the indicated times (right), and cytokine levels in the culture supernatants were quantitated by cytokine array (mean ± SD; n = 3). (C) Human MoDCs cultured at 1 × 10⁶/ml in the absence (sham) or presence of 1 µg/ml of recombinant HMGN1 for 24 h were suspended in chemotaxis medium, and their migration in response to 100 ng/ml CCL5, CCL21, or CXCL12 was measured by chemotaxis assay. The migration of DCs was enumerated by the mean (±SD) of six high-power fields (HPF) randomly chosen from triplicate wells. Shown are the results of one experiment representative of two. (D) Human MoDCs cultured in the absence or presence of 1 µg/ml HMGN1 or LPS for 48 h were irradiated at 3,000 rad and incubated in triplicate with allogeneic human peripheral blood T cells (105/well) in 0.2 ml of medium in wells of 96-well flat-bottomed plates at the indicated DC/T ratios for 5 d. The proliferation was measured as the mean (±SD) [3H]TdR incorporation of triplicate wells. Shown are the results of one experiment representative of three. (E and F) Human MoDCs were incubated at 1 × 10⁶/ml in the absence (sham) or presence of synthetic HMGN1 N-terminal domain (N1ND, HMGN11–52) or C-terminal domain (N1CD, HMGN153–100) at 10 µg/ml for 48 h before measurement of DC surface marker expression by flow cytometry (E, gray area: sham-treated DCs) and cytokine production in the supernatants (F; mean ± SD; n = 3). (G) Human DCs were incubated at 5 × 10⁵/ml in medium in the absence (sham) or presence of 1 mg/ml HMGN1 or mutated HMGN1 for 24 h before obtaining supernatants for measurement of the indicated cytokines. Shown is the mean (±SD) of triplicate wells of one experiment representative of two. *, P < 0.05 by Student’s t test when compared with the sham treatment.
Figure 2.
Figure 2.
HMGN1 induction of leukocyte recruitment. (A) 8-wk-old female C57BL/6 mice (five mice/group) were injected i.p. with PBS alone or PBS containing the indicated amount of HMGN1. After 4 h, leukocytes in the peritoneal cavity were enumerated. Shown is the mean (±SD) number of leukocytes. *, P < 0.05 by ANOVA when compared with mice injected with PBS alone. Shown are the results of one experiment representative of three. (B) Two groups of female C57BL/6 mice (10 wk old; n = 5) were injected i.p. with PBS alone or PBS containing 1 µg HMGN1. After 4 h, leukocytes were harvested from the peritoneum and immunostained with either isotype-matched control antibodies or a combination of PE-conjugated anti–mouse CD11c, FITC-conjugated anti–mouse CD11b, and APC-conjugated anti–mouse B220. The indicated subpopulations of DCs were determined by flow cytometry and calculated as fold increase induced by HMGN1 over the PBS group. Shown are the results of one experiment representative of two.
Figure 3.
Figure 3.
HMGN1 activation of DCs is dependent on TLR4 and MyD88. (A) DCs generated from bone marrow progenitors of C57BL/6 mice were incubated at 5 × 10⁵/ml in medium containing the indicated concentration of HMGN1 for 48 h, and cytokines in the supernatant were measured by cytokine array. Shown is the mean (±SD) of triplicate wells of one experiment representative of three. *, P < 0.05 by Student’s t test when compared with DCs cultured without HMGN1. (B) Mouse bone marrow–derived DCs were treated with 1 µg/ml HMGN1 for 20 or 60 min before they were solubilized in lysis buffer (106 DCs/0.1 ml), and the levels of I-κBα and phosphorylated MAPKs (p44/42, p38, and JNK) in DC lysates were detected by Western blot. After stripping, the membranes were reprobed with GAPDH and the unphosphorylated MAPKs antibodies. The results of one experiment representative of two are shown. (C) Bone marrow–derived DCs from MyD88+/+ and MyD88−/− mice were cultured at 5 × 10⁵/ml without or with 1 µg/ml HMGN1 for 48 h, and cytokines were measured by cytokine array. Shown is the mean (±SD) of three independent experiments. *, P < 0.05 by ANOVA. (D) BM-derived DCs from C3HeN and C3HeJ mice were cultured at 5 × 10⁵/ml without or with 1 µg/ml HMGN1 for 48 h, and cytokines were measured by cytokine array. Shown is the mean (±SD) of three independent experiments. *, P < 0.05 by ANOVA. (E) HMGN1 was incubated with complexes of the extracellular domain of TLR4 (TLR4 ECD) and MD2 for 30 min followed by immunoprecipitation (IP) with rabbit anti-HMGN1 (top) or mouse anti-MD2 (bottom) IgG. The immunoprecipitated proteins were separated by SDS-PAGE and Western blotted (WB) with anti-polyhistidine (top) or anti-HMGN1 (bottom) antibody. Shown are the results of one experiment representative of two. (F) 0.5 nM FLAG–TLR4ECD–MD2 was incubated with 0.8 nM [3H]LOS–CD14 in the absence or presence of endotoxin or 150 nM HMGN1. The FLAG–TLR4ECD–MD2–[3H]LOS in the reaction mixture was captured by anti-FLAG–coated beads. The radioactivity of captured [3H]LOS and uncaptured [3H]LOS was measured by scintillation spectrometry. The binding of [3H]LOS to TLR4ECD–MD2 was shown as the percentage of [3H]LOS captured. The results of one experiment representative of two are shown. (G) TLR4ECD was incubated with MD2–[3H]LOS in the absence or presence of HMGN1, and the reaction mixture was analyzed by Sephacryl HR S300 chromatography. Shown are the results of one experiment representative of two.
Figure 4.
Figure 4.
HMGN1 activates DCs in a TRIF-dependent manner. (A and B) Human MoDCs were incubated in the absence or presence of 1 µg/ml LPS or recombinant HMGN1 prepared in insect (riN1) cells at 10 µg/ml for 48 h before measurement of surface marker expression (A) or cytokine production (n = 3; B). In A, the results of one experiment representative of three are shown. Gray histograms indicate sham-treated DCs. (C) Flow cytometric analysis of the expression of DC surface molecules after treatment without or with 1 µg/ml LPS or 10 µg/ml riN1 for 48 h. Shown are the overlay histograms of C3H/HeN or C3H/HeJ DCs of one experiment representative of two (gray histograms indicate sham-treated DCs). (D) C3HeN and C3HeJ mouse DCs were cultured at 5 × 10⁵/ml in the absence or presence of 5 µg/ml riN1 for 48 h, and cytokines were measured in the supernatants. (E) Cytokine production by MyD88+/+ or MyD88−/− DCs (5 × 10⁵/ml) after 48-h treatment with or without riN1. (F) DCs from TRIF+/+ or TRIF−/− mice were incubated at 106/ml without or with 5 µg/ml riN1 for 48 h, and cytokines in the supernatants were measured. (D–F) Shown is the mean (±SD) of two (E and F) or three (D) independent experiments. *, P < 0.05 by ANOVA.
Figure 5.
Figure 5.
HMGN1 promotes antigen-specific immune responses. 8-wk-old female C57BL/6 mice were immunized i.p. with OVA (50 µg/mouse), OVA + alum (3 mg/mouse), or OVA + HMGN1 (1 µg/mouse) on day 1 and boosted i.p. with OVA on day 14. On day 21, the spleens of immunized mice were removed, and single-cell suspension was evaluated for OVA-specific cellular immune responses. (A) Splenocytes were cultured in triplicate in a 96-well plate (5 × 10⁵/0.2 ml/well) in the presence of specified concentrations of OVA for 4 d. The culture was pulsed with 1 µCi/well [3H]TdR for the last 18 h before harvest for measurement of [3H]TdR incorporation. OVA-specific proliferation of splenocytes is shown as the mean cpm (±SD) of each group (n = 4). (B) Splenocytes were cultured in duplicate in a 48-well plate (2.5 × 10⁶/0.5 ml/well) in the presence of 100 µg/ml OVA for 48 h, and cytokines in the supernatants were quantitated. Shown is the mean cytokine concentration (±SD) of each group (n = 4) of one experiment representative of three. *, P < 0.05 by ANOVA when compared with the PBS group. (C) A/J mice (n = 4, 10 wk old, female) were immunized i.p. with AVA (the licensed human anthrax vaccine in the US) in the absence or presence of HMGN1 at specified doses (1 or 5 µg/mouse) on day 1 and booster immunized i.p. on day 14. Sera were collected on day 10 and 20 for the measurement of primary and secondary antibody responses, respectively. The IgG specific for the PA of anthrax in the serum was quantitated by anti-PA ELISA. Shown is the geometric mean anti-PA titer (±SD) of each group of one representative experiment out of three. *, P < 0.05 by ANOVA when compared with the AVA alone group.
Figure 6.
Figure 6.
Reduction of antigen-specific immune responses in HMGN1 KO mice. Male HMGN1 KO (Hmgn1−/−) and littermate-matched WT (Hmgn1+/+) mice (n = 3) were immunized i.p. with OVA (50 µg/mouse) in the presence or absence of LPS (1 µg/mouse) on day 1 and boosted i.p. on day 14. On day 10 and 20, mice were bled for the separation of serum samples, which were stored at −20°C until the measurement of primary and secondary OVA-specific IgG antibody response by ELISA. (A) Primary and secondary anti-OVA titers of Hmgn1+/+ and Hmgn1−/− mice after immunization. Shown are the results of one experiment representative of three (mean ± SD). *, P < 0.05 by ANOVA. (B) OVA-specific splenocyte proliferation of splenocytes of immunized Hmgn1+/+ and Hmgn1−/− mice. Pooled splenocytes of each group were cultured in triplicate in wells of a 96-well plate (5 × 10⁵/0.2 ml/well) in the presence of specified concentrations of OVA for 4 d. The culture was pulsed with 1 µCi/well [3H]TdR for the last 18 h before harvest for measurement of [3H]TdR incorporation. The results of one experiment representative of three are shown as the mean cpm (±SD) of triplicate wells. *, P < 0.05 by Student’s t test. (C) OVA-specific cytokine production by splenocytes of immunized Hmgn1+/+ and Hmgn1−/− mice. Splenocytes were cultured in a 48-well plate (2.5 × 10⁶/0.5 ml/well) in the presence of 100 µg/ml OVA for 48 h before the measurement of cytokines in the supernatants. Shown is the mean concentration (±SD) of cytokines (n = 3). *, P < 0.05 by ANOVA. (D and E) Male Hmgn1−/− and littermate-matched Hmgn1+/+ mice (n = 4) were immunized i.p. with OVA (50 µg/mouse) or radiation-inactivated OVA-expressing E. coli (106/mouse) on day 1 and boosted i.p. on day 14. Splenocytes pooled from the five mice were cultured in triplicate in wells of a 96-well plate (5 × 10⁵/0.2 ml/well) in the presence of specified concentrations of OVA for 4 d. The cultures were pulsed with 1 µCi/well [3H]TdR for the last 18 h before harvest for measurement of [3H]TdR incorporation. The results are shown as the mean cpm (±SD) of triplicate wells. *, P < 0.05 by Student’s t test. Alternatively, splenocytes were cultured in a 48-well plate (2.5 × 10⁶/0.5 ml/well) in the presence of 100 µg/ml of OVA for 48 h before the measurement of cytokines in the supernatants. Shown is the mean concentration (±SD) of cytokines (n = 5) of one experiment representative of two. *, P < 0.05 by ANOVA.
Figure 7.
Figure 7.
Involvement of HMGN1 generated by nonleukocytes at the site of immunization in the induction of immune response. (A) HMGN1 KO (Hmgn1−/−) and littermate-matched WT (Hmgn1+/+) mice (n = 4) were i.p. immunized with OVA (50 µg/mouse) in the presence or absence of LPS (1 µg/mouse). Serum cytokines were measured at 24 and 96 h after immunization. Shown is the mean (±SD) serum cytokine concentration of each group, which is representative of three independent experiments. (B) HMGN1 KO (Hmgn1−/−) and littermate-matched WT (Hmgn1+/+) mice (n = 3) were immunized i.p. with PBS, OVA (50 µg/mouse), or OVA + LPS (1 µg/mouse). After 4 h, peritoneal leukocytes were enumerated for total leukocytes (top) or DCs (bottom; defined as CD11c and I-A/E double-positive cells). Shown is the mean (±SD) cell number of individual group of one experiment representative of two. (C) C57BL/6 mice (n = 3) were injected with OVA (50 µg/mouse) alone or OVA + LPS (1 µg/mouse). HMGN1 expression in the peritoneal cavity 4 or 22 h after injection was assessed by Western blot with anti-HMGN1 antibody. Shown are the results of one experiment representative of two. (D and E) Bone marrow chimeric mice were generated by reconstituting lethally irradiated Hmgn1−/− mice with Hmgn1+/+ bone marrow mononuclear cells (WT→KO) or vice versa (KO→WT). The chimeric mice (n = 3) were immunized i.p. with PBS containing OVA (50 µg/mouse) or OVA in the presence of LPS (1 µg/mouse) on day 1 and boosted on day 14. On day 10 and 20, OVA-specific IgG antibody responses were measured by ELISA (D). On day 21, splenocytes were cultured in a 48-well plate (2.5 × 10⁶/0.5 ml/well) in the presence of 100 µg/ml OVA for 48 h. The cytokines in the supernatants were measured and are shown as the mean concentration (±SD) of each group (E). Shown are the results of one experiment representative of two. *, P < 0.05.
Figure 8.
Figure 8.
HMGN1 contributes to innate immune responses induced by LPS. (A and B) Hmgn1−/− and littermate-matched Hmgn1+/+ mice (n = 5) were injected i.p. with 0.2 ml PBS or PBS containing 10 µg/ml LPS, 5% TG, or 50 µg/ml MDP. After 24 h, peritoneal exudates were analyzed for the total cell number (A) and inflammatory mediators (IL-6, JE, and KC) in the lavage fluid (B). Shown are the results of one experiment representative of two (mean ± SD). *, P < 0.05 by ANOVA.

References

    1. Adachi O., Kawai T., Takeda K., Matsumoto M., Tsutsui H., Sakagami M., Nakanishi K., Akira S. 1998. Targeted disruption of the MyD88 gene results in loss of IL-1- and IL-18-mediated function. Immunity. 9:143–150 10.1016/S1074-7613(00)80596-8 - DOI - PubMed
    1. Akira S., Takeda K. 2004. Toll-like receptor signalling. Nat. Rev. Immunol. 4:499–511 10.1038/nri1391 - DOI - PubMed
    1. Apetoh L., Ghiringhelli F., Tesniere A., Obeid M., Ortiz C., Criollo A., Mignot G., Maiuri M.C., Ullrich E., Saulnier P., et al. 2007. Toll-like receptor 4-dependent contribution of the immune system to anticancer chemotherapy and radiotherapy. Nat. Med. 13:1050–1059 10.1038/nm1622 - DOI - PubMed
    1. Banchereau J., Steinman R.M. 1998. Dendritic cells and the control of immunity. Nature. 392:245–252 10.1038/32588 - DOI - PubMed
    1. Bianchi M.E. 2007. DAMPs, PAMPs and alarmins: all we need to know about danger. J. Leukoc. Biol. 81:1–5 10.1189/jlb.0306164 - DOI - PubMed

Publication types

MeSH terms