. 2011 Dec 20:10:378.
doi: 10.1186/1475-2875-10-378.

A new world malaria map: Plasmodium falciparum endemicity in 2010

Affiliations

A new world malaria map: Plasmodium falciparum endemicity in 2010

Peter W Gething et al. Malar J. .

Abstract

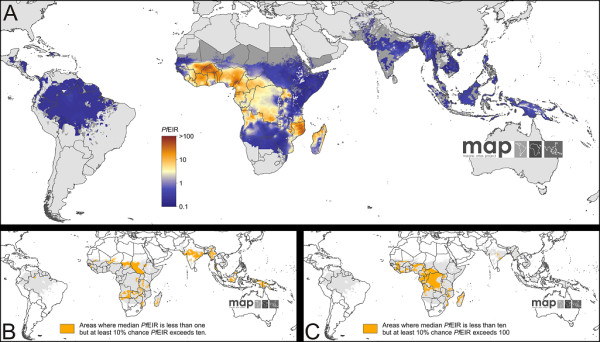
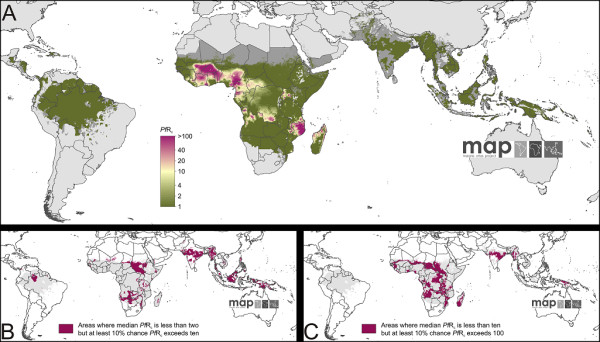
Background: Transmission intensity affects almost all aspects of malaria epidemiology and the impact of malaria on human populations. Maps of transmission intensity are necessary to identify populations at different levels of risk and to evaluate objectively options for disease control. To remain relevant operationally, such maps must be updated frequently. Following the first global effort to map Plasmodium falciparum malaria endemicity in 2007, this paper describes the generation of a new world map for the year 2010. This analysis is extended to provide the first global estimates of two other metrics of transmission intensity for P. falciparum that underpin contemporary questions in malaria control: the entomological inoculation rate (PfEIR) and the basic reproductive number (PfR).

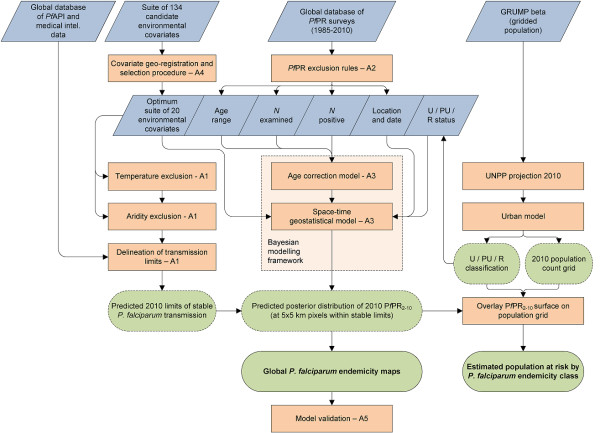
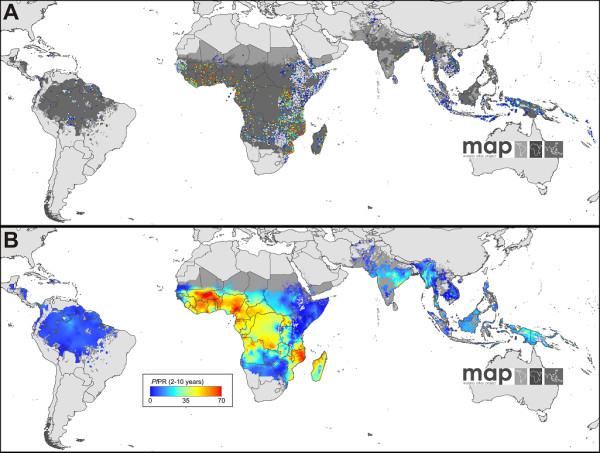
Methods: Annual parasite incidence data for 13,449 administrative units in 43 endemic countries were sourced to define the spatial limits of P. falciparum transmission in 2010 and 22,212 P. falciparum parasite rate (PfPR) surveys were used in a model-based geostatistical (MBG) prediction to create a continuous contemporary surface of malaria endemicity within these limits. A suite of transmission models were developed that link PfPR to PfEIR and PfR and these were fitted to field data. These models were combined with the PfPR map to create new global predictions of PfEIR and PfR. All output maps included measured uncertainty.

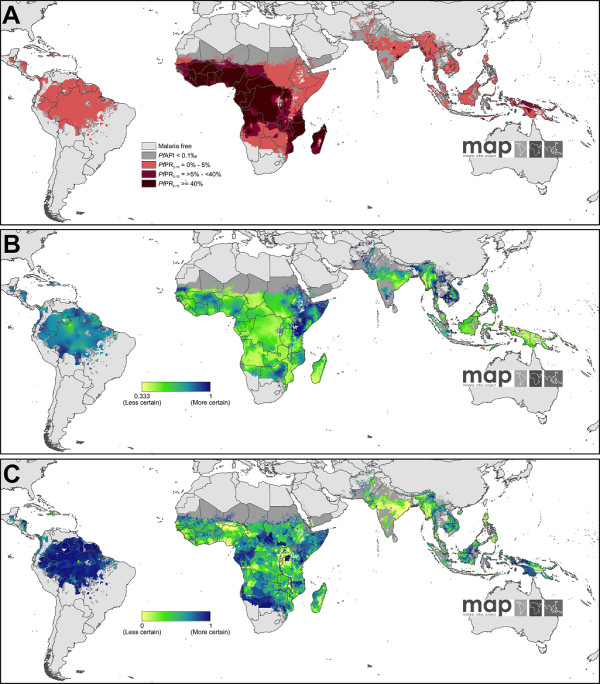
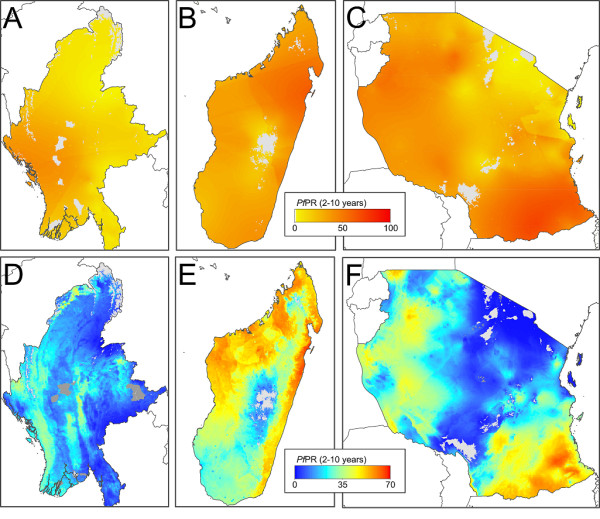
Results: An estimated 1.13 and 1.44 billion people worldwide were at risk of unstable and stable P. falciparum malaria, respectively. The majority of the endemic world was predicted with a median PfEIR of less than one and a median PfRc of less than two. Values of either metric exceeding 10 were almost exclusive to Africa. The uncertainty described in both PfEIR and PfR was substantial in regions of intense transmission.

Conclusions: The year 2010 has a particular significance as an evaluation milestone for malaria global health policy. The maps presented here contribute to a rational basis for control and elimination decisions and can serve as a baseline assessment as the global health community looks ahead to the next series of milestones targeted at 2015.


Figures

Figure 1
Figure 1
Schematic overview of the mapping procedures and methods for Plasmodium falciparum endemicity. Blue boxes describe input data. Orange boxes denote models and experimental procedures; green boxes indicate output data; dashed lines represent intermediate outputs and solid lines final outputs. U/PU/R = urban/peri-urban/rural; UNPP = United Nations Population Prospects. Labels A1-5 denote supplementrary information in Additional files 1, 2, 3, 4 &5.
Figure 2
Figure 2
The spatial distribution of Plasmodium falciparum malaria endemicity in 2010. Panel A shows the 2010 spatial Limits of P. falciparum malaria risk defined by PfAPI with further medical intelligence, temperature and aridity Masks. Areas were defined as stable (dark grey areas, where PfAPI ≥0.1 per 1,000 pa), unstable (medium grey areas, where PfAPI < 0.1 per 1,000 pa) or no risk (light grey, where PfAPI = 0 per 1,000 pa). The community surveys of P. falciparum prevalence conducted between January 1985 and June 2010 are plotted. Of the 23,612 surveys collected, 22,212 satisfied the inclusion criteria for modelling (see Methods and Additional File 1, 2) and are shown here. The survey data are age-standardized [40] (PfPR2-10) and presented as a continuum of blue to red from 0%-100% (see map legend), with zero-valued surveys shown in white. Panel B shows the MBG point estimates of the annual mean PfPR2-10 for 2010 within the spatial limits of stable P. falciparum malaria transmission, displayed on the same colour scale. Areas of no risk or unstable risk are as in (A).
Figure 3
Figure 3
The Spatial distribution of Plasmodium falciparum malaria PfPR2-10 in 2010 stratified by endemicity class [2], and associated uncertainty. Panel A shows predictions categorized as low risk PfPR2-10 ≤5% light red; intermediate risk PfPR2-10 > 5% to < 40%, medium red; and high risk PfPR2-10 ≥40%, dark red. The map shows the class to which PfPR2-10 has the highest predicted probability of membership. The rest of the land area was defined as unstable risk (medium grey areas, where PfAPI < 0.1 per 1,000 pa) or no risk (light grey). Panel B shows the probability of PfPR2-10 being in the class to which it was assigned as a yellow to blue continuum from 0.3˙-1. Any value above 0.3˙ is better than a chance allocation. Panel C shows the population-weighted index of uncertainty. This index shows the likely importance of uncertainty assessed by the product of the log of population density and the reciprocal of the probability of correct class assignment, rescaled from 0-1 to correspond to Panel B so that least uncertain areas have higher values in blue and most uncertain have lower values in yellow. The index is shown for the most probable PfPR2-10 endemicity class.
Figure 4
Figure 4
National-level comparisons between the current and previous predicted PfPR2-10 endemicity surfaces. Panels A, B and C are extracts from the earlier 2007 mapping study [3] whilst panels D, E, and F are from the current study for 2010. The example countries shown are Myanmar (northern part), (A, D), Madagascar (B, E) and Tanzania (C, F). The colour scale for panels A, B, C is that used in the 2007 study. The scale shown in panels D, E, F corresponds to that used in Figure 2. Medium grey areas indicate a classification of unstable transmission risk and light grey as risk-free. The geographic scale varies between countries.
Figure 5
Figure 5
The spatial distribution of Plasmodium falciparum entomological inoculation rate (PfEIR) in 2010. Panel A shows the point estimate (posterior median) PfEIR prediction for each pixel within the stable limits of transmission in 2010. The colour scale is logarithmic to allow better differentiation across the heavily positively skewed distribution of values. Areas of unstable transmission (medium grey areas, where PfAPI < 0.1 per 1,000 pa) or no risk (light grey, where PfAPI = 0 per 1,000 pa) are also demarked. Panels B and C provide two indicators of the uncertainty associated with predictions, showing areas with a median prediction less than one or less than ten but where the 90th percentile is at least an order of magnitude larger.
Figure 6
Figure 6
The spatial distribution of Plasmodium falciparum basic reproductive number under control (PfRc) in 2010. Panel A shows the point estimate (posterior median) PfRc prediction for each pixel within the stable limits of transmission in 2010. The colour scale is logarithmic to allow better differentiation across the heavily positively skewed distribution of values. Areas of unstable transmission (medium grey areas, where PfAPI < 0.1 per 1,000 pa) or no risk (light grey, where PfAPI = 0 per 1,000 pa) are also demarked. Panels B and C provide two indicators of the uncertainty associated with predictions, showing areas with a median prediction less than two or less than ten but where the 90th percentile is at least an order of magnitude larger.

Similar articles

Cited by

References

    1. Hay SI, Snow RW. The Malaria Atlas Project: developing global maps of malaria risk. PLoS Med. 2006;3:e473. doi: 10.1371/journal.pmed.0030473. - DOI - PMC - PubMed
    1. Hay SI, Smith DL, Snow RW. Measuring malaria endemicity from intense to interrupted transmission. Lancet Infect Dis. 2008;8:369–378. doi: 10.1016/S1473-3099(08)70069-0. - DOI - PMC - PubMed
    1. Hay SI, Guerra CA, Gething PW, Patil AP, Tatem AJ, Noor AM, Kabaria CW, Manh BH, Elyazar IRF, Brooker SJ, Smith DL, Moyeed RA, Snow RW. A world malaria map: Plasmodium falciparum endemicity in 2007. PLoS Med. 2009;6:e1000048. - PMC - PubMed
    1. Anonymous. The African Summit on Roll Back Malaria. Roll Back Malaria/World Health Organization; The Abuja Declaration and the Plan of Action: An extract from The African Summit on Roll Back Malaria, Abuja, 25 April 2000 (WHO/CDS/RBM/2000.17) pp. 1–11.
    1. WHO. Global strategic plan. Roll Back Malaria. 2005-2015. Geneva: World Health Organization; 2005.

Publication types

LinkOut - more resources