

An expression map for Anopheles gambiae
- PMID: 22185628
- PMCID: PMC3341590
- DOI: 10.1186/1471-2164-12-620
An expression map for Anopheles gambiae
Abstract
Background: Quantitative transcriptome data for the malaria-transmitting mosquito Anopheles gambiae covers a broad range of biological and experimental conditions, including development, blood feeding and infection. Web-based summaries of differential expression for individual genes with respect to these conditions are a useful tool for the biologist, but they lack the context that a visualisation of all genes with respect to all conditions would give. For most organisms, including A. gambiae, such a systems-level view of gene expression is not yet available.
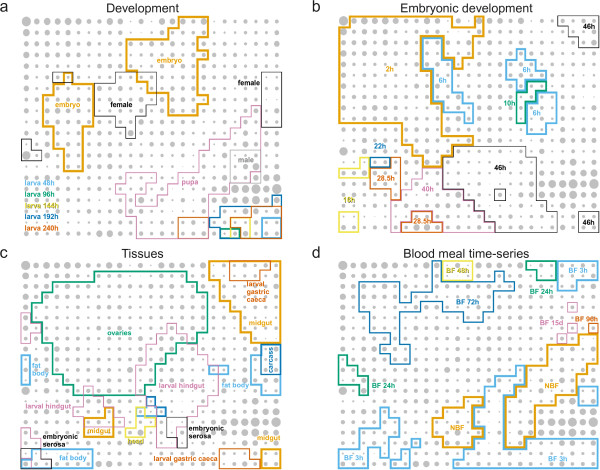
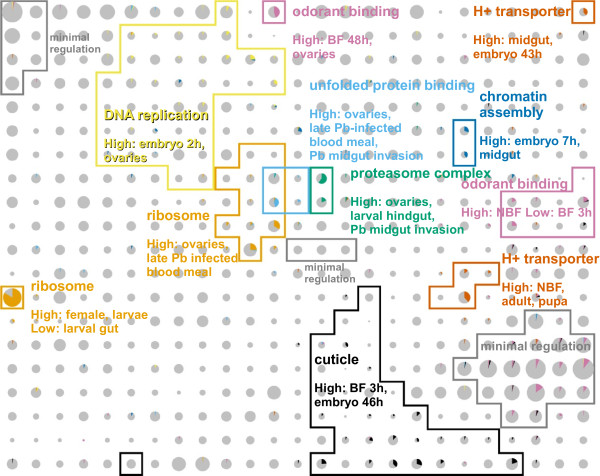
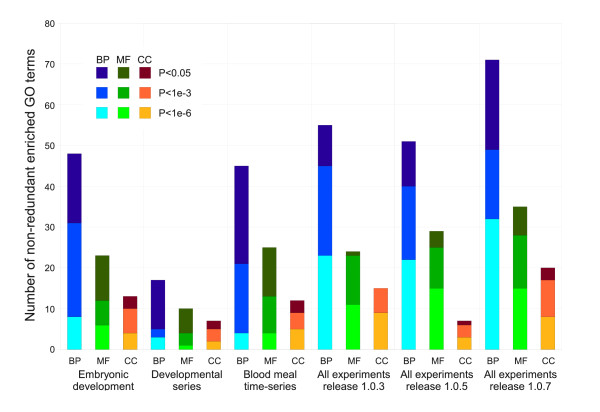
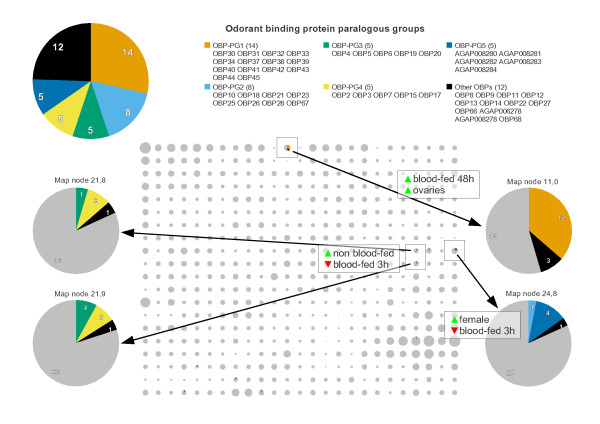
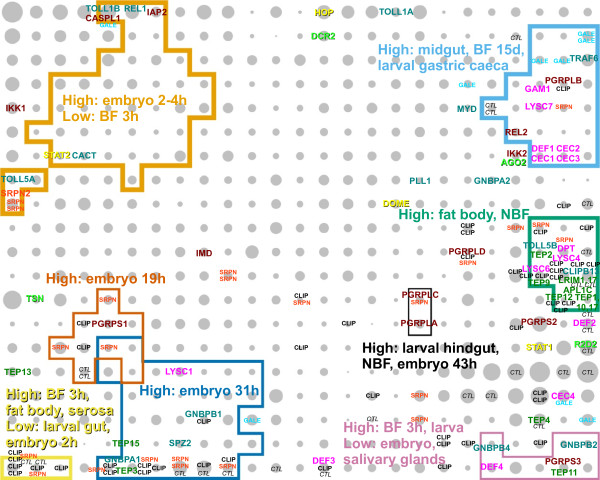
Results: We have clustered microarray-based gene-averaged expression values, available from VectorBase, for 10194 genes over 93 experimental conditions using a self-organizing map. Map regions corresponding to known biological events, such as egg production, are revealed. Many individual gene clusters (nodes) on the map are highly enriched in biological and molecular functions, such as protein synthesis, protein degradation and DNA replication. Gene families, such as odorant binding proteins, can be classified into distinct functional groups based on their expression and evolutionary history. Immunity-related genes are non-randomly distributed in several distinct regions on the map, and are generally distant from genes with house-keeping roles. Each immunity-rich region appears to represent a distinct biological context for pathogen recognition and clearance (e.g. the humoral and gut epithelial responses). Several immunity gene families, such as peptidoglycan recognition proteins (PGRPs) and defensins, appear to be specialised for these distinct roles, while three genes with physically interacting protein products (LRIM1/APL1C/TEP1) are found in close proximity.
Conclusions: The map provides the first genome-scale, multi-experiment overview of gene expression in A. gambiae and should also be useful at the gene-level for investigating potential interactions. A web interface is available through the VectorBase website http://www.vectorbase.org/. It is regularly updated as new experimental data becomes available.
Figures
Similar articles
-
Structure-function analysis of the Anopheles gambiae LRIM1/APL1C complex and its interaction with complement C3-like protein TEP1.PLoS Pathog. 2011 Apr;7(4):e1002023. doi: 10.1371/journal.ppat.1002023. Epub 2011 Apr 14. PLoS Pathog. 2011. PMID: 21533217 Free PMC article.
-
Identification and expression profiling of putative odorant-binding proteins in the malaria mosquitoes, Anopheles gambiae and A. arabiensis.Sci China C Life Sci. 2004 Dec;47(6):567-76. doi: 10.1360/03yc0232. Sci China C Life Sci. 2004. PMID: 15620114
-
Identification and expression of odorant-binding proteins of the malaria-carrying mosquitoes Anopheles gambiae and Anopheles arabiensis.Arch Insect Biochem Physiol. 2005 Mar;58(3):175-89. doi: 10.1002/arch.20047. Arch Insect Biochem Physiol. 2005. PMID: 15717318
-
Biophysical analysis of anopheles gambiae leucine-rich repeat proteins APL1A1, APL1B [corrected] and APL1C and their interaction with LRIM1.PLoS One. 2015 Mar 16;10(3):e0118911. doi: 10.1371/journal.pone.0118911. eCollection 2015. PLoS One. 2015. PMID: 25775123 Free PMC article.
-
Identification of a distinct family of genes encoding atypical odorant-binding proteins in the malaria vector mosquito, Anopheles gambiae.Insect Mol Biol. 2003 Dec;12(6):549-60. doi: 10.1046/j.1365-2583.2003.00440.x. Insect Mol Biol. 2003. PMID: 14986916
Cited by
-
Anopheles gambiae blood feeding initiates an anticipatory defense response to Plasmodium berghei.J Innate Immun. 2015;7(1):74-86. doi: 10.1159/000365331. Epub 2014 Sep 19. J Innate Immun. 2015. PMID: 25247883 Free PMC article.
-
The roles of serpins in mosquito immunology and physiology.J Insect Physiol. 2013 Feb;59(2):138-47. doi: 10.1016/j.jinsphys.2012.08.015. Epub 2012 Sep 5. J Insect Physiol. 2013. PMID: 22960307 Free PMC article. Review.
-
Insights into the epigenomic landscape of the human malaria vector Anopheles gambiae.Front Genet. 2014 Aug 15;5:277. doi: 10.3389/fgene.2014.00277. eCollection 2014. Front Genet. 2014. PMID: 25177345 Free PMC article.
-
The transcription factor Maf-S regulates metabolic resistance to insecticides in the malaria vector Anopheles gambiae.BMC Genomics. 2017 Aug 30;18(1):669. doi: 10.1186/s12864-017-4086-7. BMC Genomics. 2017. PMID: 28854876 Free PMC article.
-
Kinetics of Plasmodium midgut invasion in Anopheles mosquitoes.PLoS Pathog. 2020 Sep 18;16(9):e1008739. doi: 10.1371/journal.ppat.1008739. eCollection 2020 Sep. PLoS Pathog. 2020. PMID: 32946522 Free PMC article.
References
-
- Holt RA, Subramanian GM, Halpern A, Sutton GG, Charlab R, Nusskern DR, Wincker P, Clark AG, Ribeiro JM, Wides R, Salzberg SL, Loftus B, Yandell M, Majoros WH, Rusch DB, Lai Z, Kraft CL, Abril JF, Anthouard V, Arensburger P, Atkinson PW, Baden H, de Berardinis V, Baldwin D, Benes V, Biedler J, Blass C, Bolanos R, Boscus D, Barnstead M, Cai S, Center A, Chaturverdi K, Christophides GK, Chrystal MA, Clamp M, Cravchik A, Curwen V, Dana A, Delcher A, Dew I, Evans CA, Flanigan M, Grundschober-Freimoser A, Friedli L, Gu Z, Guan P, Guigo R, Hillenmeyer ME, Hladun SL, Hogan JR, Hong YS, Hoover J, Jaillon O, Ke Z, Kodira C, Kokoza E, Koutsos A, Letunic I, Levitsky A, Liang Y, Lin JJ, Lobo NF, Lopez JR, Malek JA, McIntosh TC, Meister S, Miller J, Mobarry C, Mongin E, Murphy SD, O'Brochta DA, Pfannkoch C, Qi R, Regier MA, Remington K, Shao H, Sharakhova MV, Sitter CD, Shetty J, Smith TJ, Strong R, Sun J, Thomasova D, Ton LQ, Topalis P, Tu Z, Unger MF, Walenz B, Wang A, Wang J, Wang M, Wang X, Woodford KJ, Wortman JR, Wu M, Yao A, Zdobnov EM, Zhang H, Zhao Q, Zhao S, Zhu SC, Zhimulev I, Coluzzi M, della Torre A, Roth CW, Louis C, Kalush F, Mural RJ, Myers EW, Adams MD, Smith HO, Broder S, Gardner MJ, Fraser CM, Birney E, Bork P, Brey PT, Venter JC, Weissenbach J, Kafatos FC, Collins FH, Hoffman SL. The genome sequence of the malaria mosquito Anopheles gambiae. Science. 2002;298:129–149. doi: 10.1126/science.1076181. - DOI - PubMed
-
- Barrett T, Troup DB, Wilhite SE, Ledoux P, Rudnev D, Evangelista C, Kim IF, Soboleva A, Tomashevsky M, Marshall KA, Phillippy KH, Sherman PM, Muertter RN, Edgar R. NCBI GEO: archive for high-throughput functional genomic data. Nucleic Acids Res. 2009;37:D885–890. doi: 10.1093/nar/gkn764. - DOI - PMC - PubMed
-
- Parkinson H, Kapushesky M, Kolesnikov N, Rustici G, Shojatalab M, Abeygunawardena N, Berube H, Dylag M, Emam I, Farne A, Holloway E, Lukk M, Malone J, Mani R, Pilicheva E, Rayner TF, Rezwan F, Sharma A, Williams E, Bradley XZ, Adamusiak T, Brandizi M, Burdett T, Coulson R, Krestyaninova M, Kurnosov P, Maguire E, Neogi SG, Rocca-Serra P, Sansone SA, Sklyar N, Zhao M, Sarkans U, Brazma A. ArrayExpress update-from an archive of functional genomics experiments to the atlas of gene expression. Nucleic Acids Res. 2009;37:D868–872. doi: 10.1093/nar/gkn889. - DOI - PMC - PubMed
-
- Lawson D, Arensburger P, Atkinson P, Besansky NJ, Bruggner RV, Butler R, Campbell KS, Christophides GK, Christley S, Dialynas E, Hammond M, Hill CA, Konopinski N, Lobo NF, MacCallum RM, Madey G, Megy K, Meyer J, Redmond S, Severson DW, Stinson EO, Topalis P, Birney E, Gelbart WM, Kafatos FC, Louis C, Collins FH. VectorBase: A data resource for invertebrate vector genomics. Nucleic Acids Res. 2009;37:D583–587. doi: 10.1093/nar/gkn857. - DOI - PMC - PubMed
Publication types
MeSH terms
Substances
LinkOut - more resources
Full Text Sources
Research Materials
