

Morphometic analysis of TCGA glioblastoma multiforme
- PMID: 22185703
- PMCID: PMC3271112
- DOI: 10.1186/1471-2105-12-484
Morphometic analysis of TCGA glioblastoma multiforme
Abstract
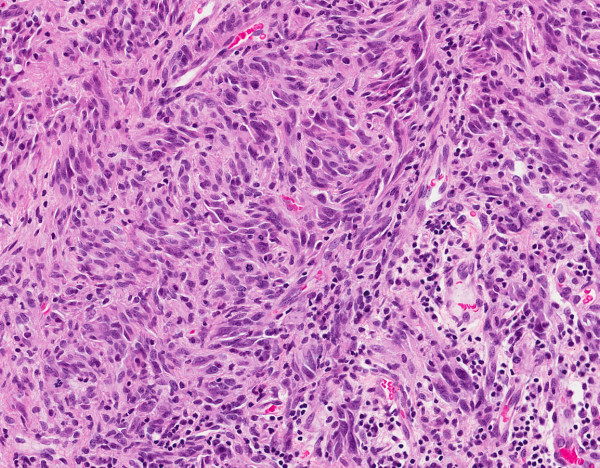
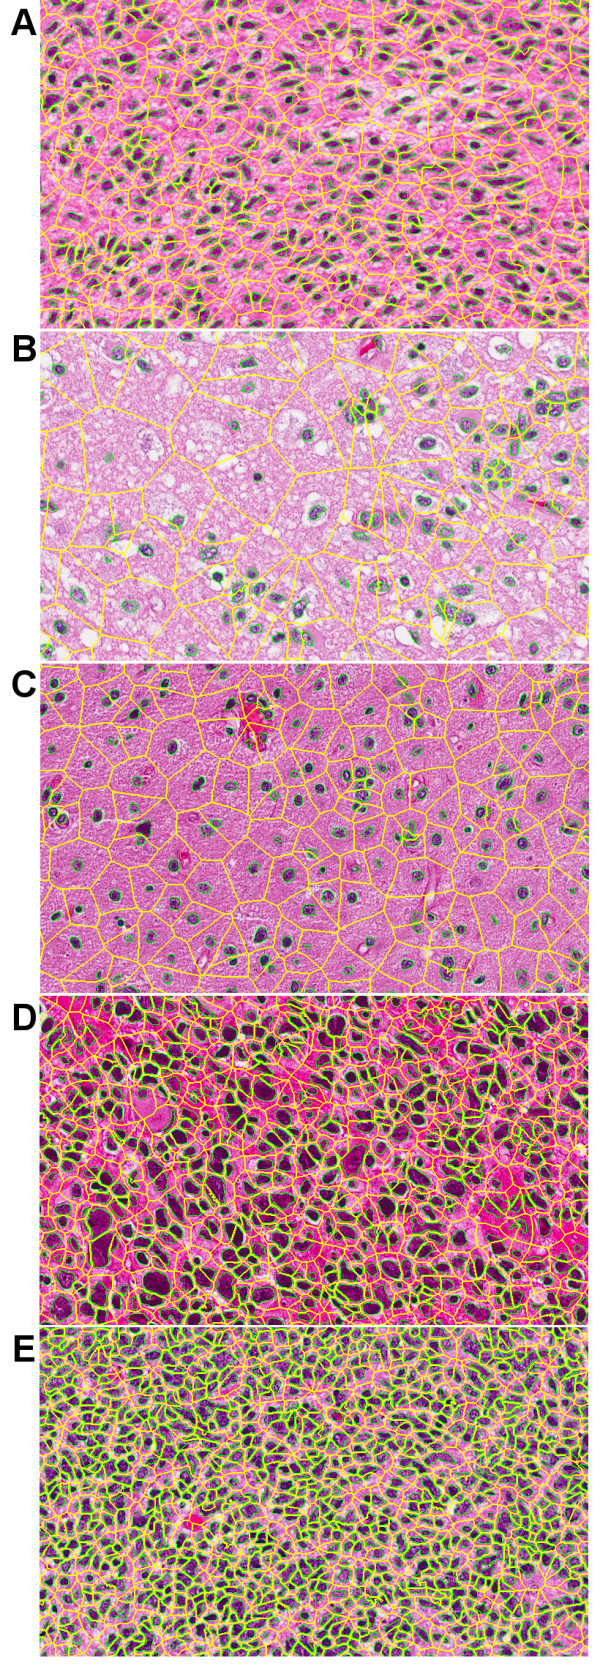
Background: Our goals are to develop a computational histopathology pipeline for characterizing tumor types that are being generated by The Cancer Genome Atlas (TCGA) for genomic association. TCGA is a national collaborative program where different tumor types are being collected, and each tumor is being characterized using a variety of genome-wide platforms. Here, we have developed a tumor-centric analytical pipeline to process tissue sections stained with hematoxylin and eosin (H&E) for visualization and cell-by-cell quantitative analysis. Thus far, analysis is limited to Glioblastoma Multiforme (GBM) and kidney renal clear cell carcinoma tissue sections. The final results are being distributed for subtyping and linking the histology sections to the genomic data.
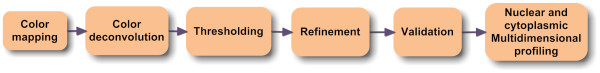
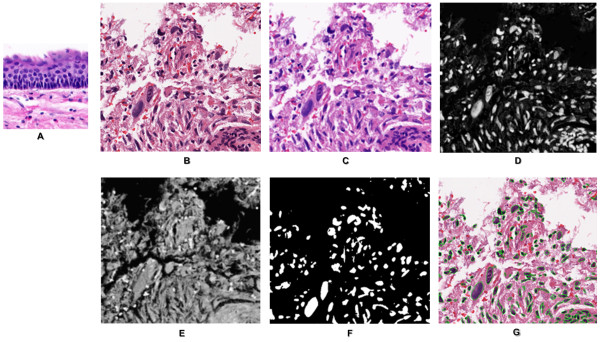
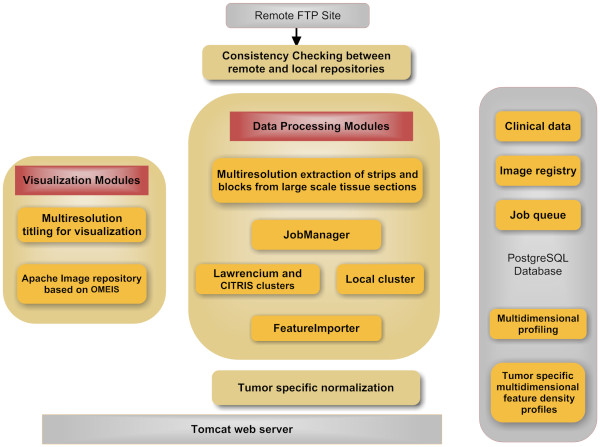
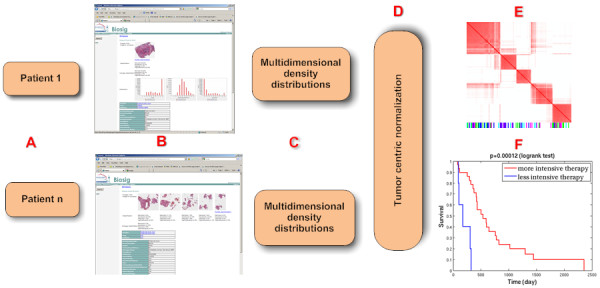
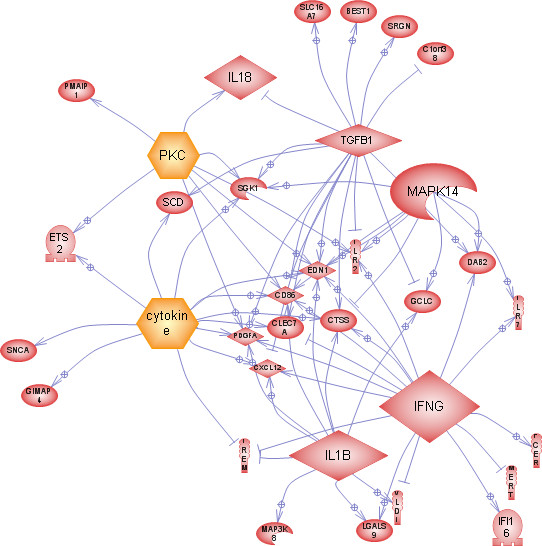
Results: A computational pipeline has been designed to continuously update a local image database, with limited clinical information, from an NIH repository. Each image is partitioned into blocks, where each cell in the block is characterized through a multidimensional representation (e.g., nuclear size, cellularity). A subset of morphometric indices, representing potential underlying biological processes, can then be selected for subtyping and genomic association. Simultaneously, these subtypes can also be predictive of the outcome as a result of clinical treatments. Using the cellularity index and nuclear size, the computational pipeline has revealed five subtypes, and one subtype, corresponding to the extreme high cellularity, has shown to be a predictor of survival as a result of a more aggressive therapeutic regime. Further association of this subtype with the corresponding gene expression data has identified enrichment of (i) the immune response and AP-1 signaling pathways, and (ii) IFNG, TGFB1, PKC, Cytokine, and MAPK14 hubs.
Conclusion: While subtyping is often performed with genome-wide molecular data, we have shown that it can also be applied to categorizing histology sections. Accordingly, we have identified a subtype that is a predictor of the outcome as a result of a therapeutic regime. Computed representation has become publicly available through our Web site.
Figures
References
-
- Demir C, Yener B. Automated cancer diagnosis based on histopathological images: a systematic survey. Rensselaer Polytechnic Institute; 2009.
-
- Latson L, Sebek N, Powell K. Automated cell nuclear segmentation in color images of hematoxylin and eosin-stained breast biopsy. Analytical and Quantitative Cytology and Histology. 2003;26(6):321–331. - PubMed
-
- Doyle S, Feldman M, Tomaszewski J, Shih N, Madabhushu A. International Synposium on Biomedical Imaging: from nano to macro. IEEE; 2011. Cascade multi-class pairwise classifier (CASCAMPA) for normal, cancerous, and cancer confunder classes in prostate histology; pp. 715–718.
Publication types
MeSH terms
Grants and funding
LinkOut - more resources
Full Text Sources
Other Literature Sources
Miscellaneous
