Review
. 2011 Oct 3;11 Spec No A(1A):S129-45.
doi: 10.1102/1470-7330.2011.9034.

Bony metastases: assessing response to therapy with whole-body diffusion MRI

Affiliations
Review

Bony metastases: assessing response to therapy with whole-body diffusion MRI

A R Padhani et al. Cancer Imaging. .

Abstract

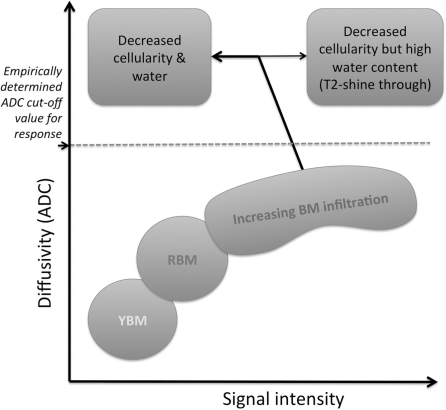
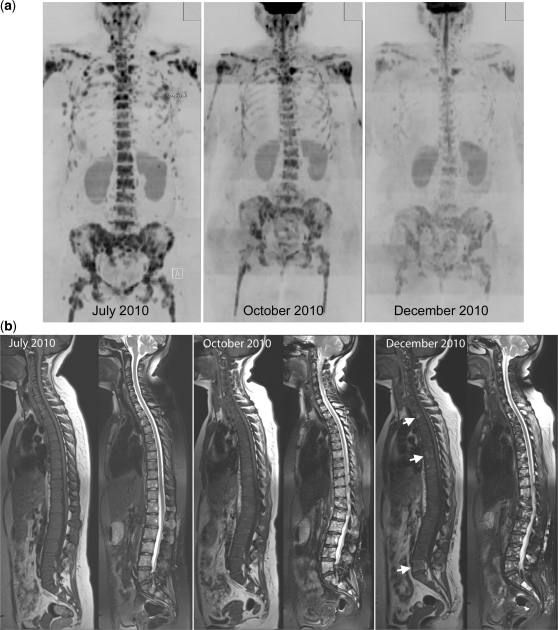
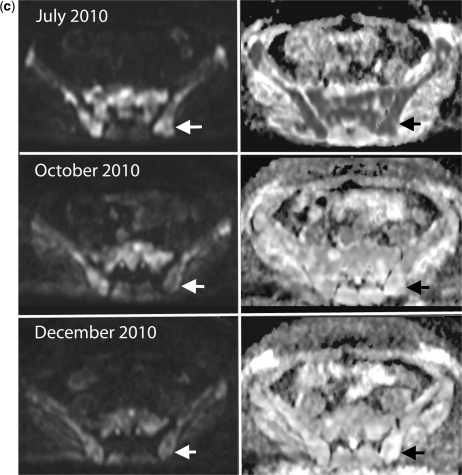
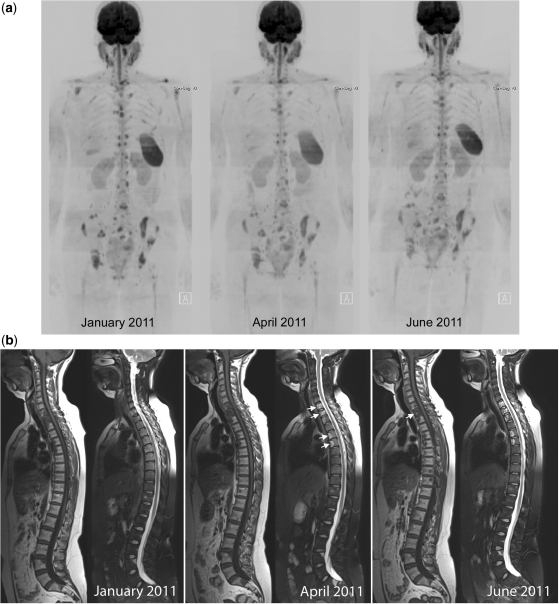
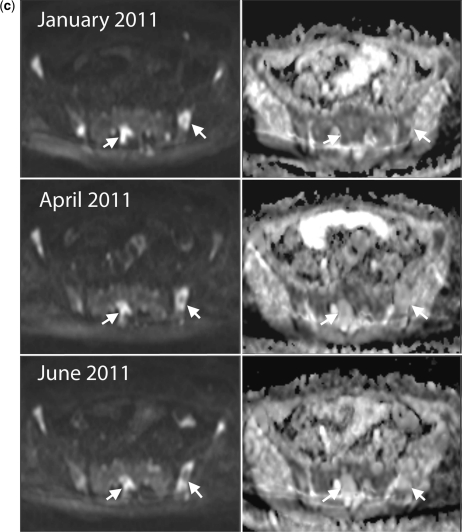
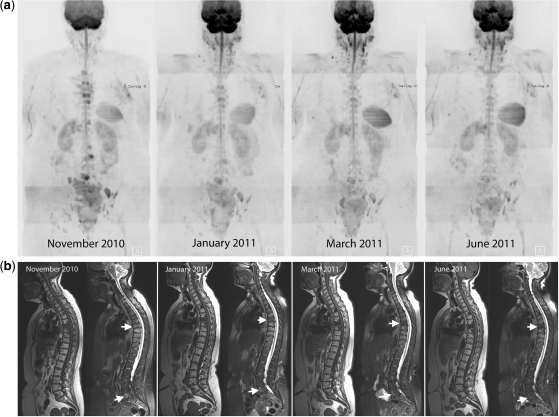
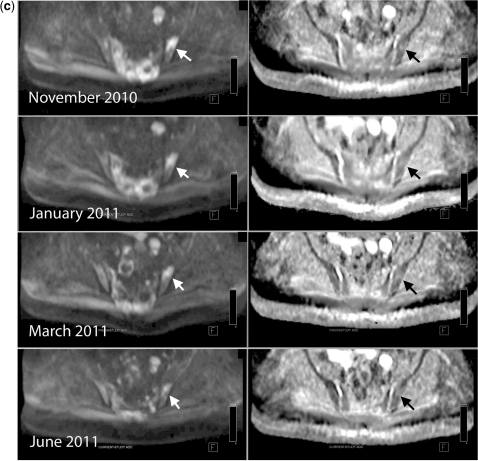
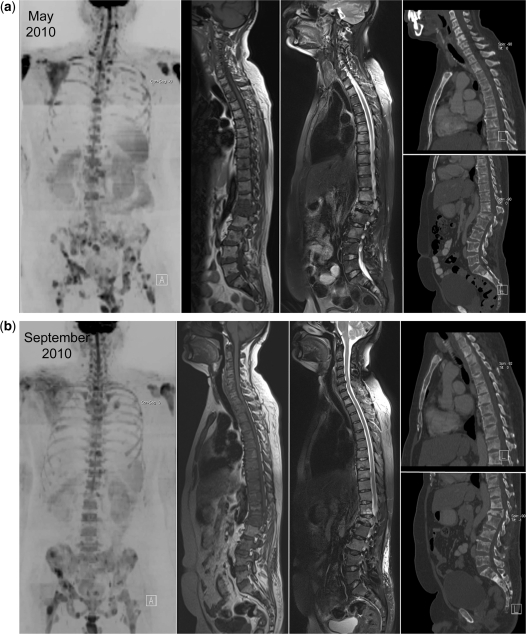
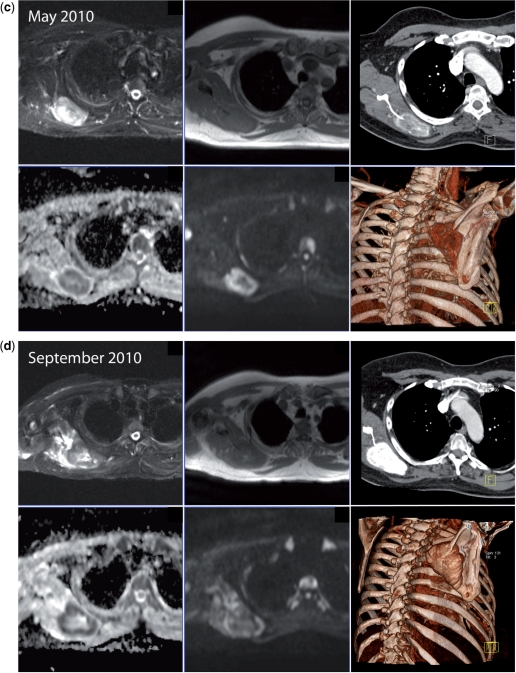
There are no universally accepted methods for assessing tumour response in skeletal sites with metastatic disease; response is assessed by a combination of imaging tests, serum and urine biochemical markers and symptoms assessments. Whole-body diffusion magnetic resonance imaging excels at bone marrow assessments at diagnosis and for therapy evaluations. It can potentially address unmet clinical and pharmaceutical needs for a reliable measure of tumour response. Signal intensity on high b-value images and apparent diffusion coefficient values can be related to underlying biophysical properties of skeletal metastases. Four patterns of change in response to therapy are described this review. Therapy response criteria need to be tested in prospective clinical studies that incorporate conventional measures of patient benefit.


Figures

Figure 1
Figure 1
Relationship between bone marrow diffusion signal intensity and ADC before and in response to successful therapy. An abundance of yellow bone marrow (YBM) fat causes low signal intensity on high b-value DW images. Increasing bone marrow cellularity of red bone marrow (RBM) and water content increases signal intensity and paradoxically increases ADC values also. Further increases in bone marrow cell density can cause lowering of ADC values although this is incompletely documented. Successful therapy results in increases in ADC values and decreases in signal intensity consistent with decreasing cellularity but T2-shine through effects following therapy would increase both signal intensity and ADC values.
Figure 2
Figure 2
Variable normal bone marrow signal intensity in women without and with metastatic disease. b900 3D-MIP (inverted scale) WB-DWI images of 4 middle-aged women with a history of breast cancer without metastatic bony disease (left 3 images) and with bony metastases (right side image). Ages are indicated (yo, years old). The first image shows a clearly outlined spinal cord with low signal intensity from the ribs and pelvic bone marrow indicating yellow bone marrow atrophy. The 4th right hand side image shows a woman with extensive bony metastases with multiple focal high signal intensity lesions in the axial skeleton. Asymmetry in the depiction of axillary nodes is due to nodal dissections. Other normal structures (kidneys, spleen, bowel, gall bladder) and soft tissue metastases (liver in the 1st image) are visible but not specifically annotated in these images.
Figure 3
Figure 3
Disease progression in multiple myeloma. A 69-year-old man with multiple myeloma. Disease progression despite treatment with lenalidomide and dexamethasone. (a) Serial b900 3D-MIP (inverted scale) images. There are progressive increases in signal intensity over time despite therapy, particularly noticeable in the bony pelvis. New areas of bony disease involvement are also seen (ribs, left femur, pelvis). There is extra-osseous soft tissue disease at the right renal hilum and around the expanding left iliac bony lesion (arrows). General signal intensity reductions of the background bone marrow suggesting atrophy are also noted. (b) Serial whole spine sagittal T1W and T2W images. The subtle textural change of the D3 vertebral body seen on the January 2011 (arrow) study enlarges considerably in May 2011, signifying progression of disease (middle panel arrow). Other lesions remain relatively stable in appearance apart from some loss in height of D5. By July 2011, there is marked loss in height of D3 (last panel, top arrow) and increasing myelomatous infiltration at L2 (last panel, lower arrow). There is a collapse of the L5 vertebral body. (c) Axial b900 (left column) and ADC maps (right column) through the pelvis showing disease progression of the left iliac bone lesion. In January the lesion shows high signal intensity on the high b-value image and on the ADC maps (mean ADC 1915 μm2/s; SD 252) consistent with T2-shine through (arrows). Progressive increase in tumour signal intensity extent can be seen with extra-osseous soft tissue tumour associated with decreases in ADC values (middle and lower rows; May: mean ADC 1133 μm2/s (SD 420) and July 1040 μm2/s (SD 285)).
Figure 3
Figure 3
Disease progression in multiple myeloma. A 69-year-old man with multiple myeloma. Disease progression despite treatment with lenalidomide and dexamethasone. (a) Serial b900 3D-MIP (inverted scale) images. There are progressive increases in signal intensity over time despite therapy, particularly noticeable in the bony pelvis. New areas of bony disease involvement are also seen (ribs, left femur, pelvis). There is extra-osseous soft tissue disease at the right renal hilum and around the expanding left iliac bony lesion (arrows). General signal intensity reductions of the background bone marrow suggesting atrophy are also noted. (b) Serial whole spine sagittal T1W and T2W images. The subtle textural change of the D3 vertebral body seen on the January 2011 (arrow) study enlarges considerably in May 2011, signifying progression of disease (middle panel arrow). Other lesions remain relatively stable in appearance apart from some loss in height of D5. By July 2011, there is marked loss in height of D3 (last panel, top arrow) and increasing myelomatous infiltration at L2 (last panel, lower arrow). There is a collapse of the L5 vertebral body. (c) Axial b900 (left column) and ADC maps (right column) through the pelvis showing disease progression of the left iliac bone lesion. In January the lesion shows high signal intensity on the high b-value image and on the ADC maps (mean ADC 1915 μm2/s; SD 252) consistent with T2-shine through (arrows). Progressive increase in tumour signal intensity extent can be seen with extra-osseous soft tissue tumour associated with decreases in ADC values (middle and lower rows; May: mean ADC 1133 μm2/s (SD 420) and July 1040 μm2/s (SD 285)).
Figure 4
Figure 4
Disease response in breast cancer. Successful therapy causes decreases in signal intensity on high b-value images and increases in ADC values. A 38-year-old woman with triple negative breast cancer treated with gemcitabine and carboplatin chemotherapy and bisphosphonates. (a) Serial b900 3D-MIP (inverted scale) images (left panel before therapy, middle panel after 3 months and right panel after 5 months of treatment). There is extensive bony metastatic disease throughout the skeleton at baseline with a diffuse pattern of disease. Serial reductions in the bony marrow signal intensity are observed indicating an overall excellent response to treatment. (b) Serial whole spine sagittal T1W and T2W images. Widespread infiltration of the vertebral bone marrow is evident on T1W images. An increase in signal intensity on T2W images is seen at several levels after 3 months of treatment. It is impossible to tell on T1W imaging whether a response has occurred in the bone marrow. After 5 months of treatment the presence of small amounts of fat within several vertebral bodies (arrows) is observed on T1W images consistent with a healing response. Interval loss of vertebral height at T12 is observed. (c) Axial b900 (left column) and ADC maps (right column) showing marked increases in ADC values of the pelvic bone marrow after treatment. The top panel shows metastatic disease involving the sacrum and iliac bones with a pretherapy mean ADC of 823 μm2/s (SD 162) of the left iliac bone (arrows). The middle panel, 3 months after therapy, shows a mean ADC of 1769 μm2/s (SD 149) at the same level and the lower panel after 5 months shows a mean ADC of 1926 μm2/s (SD 207).
Figure 4
Figure 4
Disease response in breast cancer. Successful therapy causes decreases in signal intensity on high b-value images and increases in ADC values. A 38-year-old woman with triple negative breast cancer treated with gemcitabine and carboplatin chemotherapy and bisphosphonates. (a) Serial b900 3D-MIP (inverted scale) images (left panel before therapy, middle panel after 3 months and right panel after 5 months of treatment). There is extensive bony metastatic disease throughout the skeleton at baseline with a diffuse pattern of disease. Serial reductions in the bony marrow signal intensity are observed indicating an overall excellent response to treatment. (b) Serial whole spine sagittal T1W and T2W images. Widespread infiltration of the vertebral bone marrow is evident on T1W images. An increase in signal intensity on T2W images is seen at several levels after 3 months of treatment. It is impossible to tell on T1W imaging whether a response has occurred in the bone marrow. After 5 months of treatment the presence of small amounts of fat within several vertebral bodies (arrows) is observed on T1W images consistent with a healing response. Interval loss of vertebral height at T12 is observed. (c) Axial b900 (left column) and ADC maps (right column) showing marked increases in ADC values of the pelvic bone marrow after treatment. The top panel shows metastatic disease involving the sacrum and iliac bones with a pretherapy mean ADC of 823 μm2/s (SD 162) of the left iliac bone (arrows). The middle panel, 3 months after therapy, shows a mean ADC of 1769 μm2/s (SD 149) at the same level and the lower panel after 5 months shows a mean ADC of 1926 μm2/s (SD 207).
Figure 5
Figure 5
Disease response in breast cancer. T2-shine through indicating successful response to therapy. A 42-year-old woman with metastatic breast cancer treated with capecitabine and bisphosphonates. (a) Serial b900 3D-MIP (inverted scale) images. Left panel before therapy, middle panel after 3 months and right panel after 5 months of treatment. Widespread bony metastatic disease within the vertebral column, ribs, pelvis and proximal femora. No significant alterations in signal intensity of individual lesions are observed post-therapy despite a clinical response to treatment. (b) Serial whole spine sagittal T1W and T2W images. An increase in signal intensity on T2W images within lesions involving the upper dorsal vertebrae at both 3 and 5 months after therapy in keeping with an increase in water content (arrows, middle panel). Lesions appear to have sharper margins on T1W images and have increasing fat content consistent with a healing response (arrow last panel). (c) Axial b900 (left column) and ADC maps (right column) showing marked increases in ADC values of the pelvic bone marrow after treatment. The top panel shows hypercellular metastatic lesions within the sacrum (right-sided arrow) and left iliac bone (left-sided arrow) before therapy shown by increased signal intensity and low ADC values. For example, the mean ADC of the sacral lesion is 882 μm2/s (SD 137) before therapy. The middle and lower panels at 3 and 5 months after treatment demonstrate sustained increases in signal intensity on b900 images but increases in ADC values are seen. The mean ADC within the sacral lesion at 3 months after therapy is 1592 μm2/s (SD 110) and at 5 months is largely unaltered at 1461 μm2/s (SD 209).
Figure 5
Figure 5
Disease response in breast cancer. T2-shine through indicating successful response to therapy. A 42-year-old woman with metastatic breast cancer treated with capecitabine and bisphosphonates. (a) Serial b900 3D-MIP (inverted scale) images. Left panel before therapy, middle panel after 3 months and right panel after 5 months of treatment. Widespread bony metastatic disease within the vertebral column, ribs, pelvis and proximal femora. No significant alterations in signal intensity of individual lesions are observed post-therapy despite a clinical response to treatment. (b) Serial whole spine sagittal T1W and T2W images. An increase in signal intensity on T2W images within lesions involving the upper dorsal vertebrae at both 3 and 5 months after therapy in keeping with an increase in water content (arrows, middle panel). Lesions appear to have sharper margins on T1W images and have increasing fat content consistent with a healing response (arrow last panel). (c) Axial b900 (left column) and ADC maps (right column) showing marked increases in ADC values of the pelvic bone marrow after treatment. The top panel shows hypercellular metastatic lesions within the sacrum (right-sided arrow) and left iliac bone (left-sided arrow) before therapy shown by increased signal intensity and low ADC values. For example, the mean ADC of the sacral lesion is 882 μm2/s (SD 137) before therapy. The middle and lower panels at 3 and 5 months after treatment demonstrate sustained increases in signal intensity on b900 images but increases in ADC values are seen. The mean ADC within the sacral lesion at 3 months after therapy is 1592 μm2/s (SD 110) and at 5 months is largely unaltered at 1461 μm2/s (SD 209).
Figure 6
Figure 6
Clinical response with decreases in signal intensity on high b-value images and unchanged ADC values. A 60-year-old woman with metastatic breast cancer treated with capecitabine and bisphosphonates. (a) Serial b900 3D-MIP (inverted scale) images. Scans at intervals of approximately 2–3 months after therapy. Reductions in signal intensity in the majority of lesions within the vertebral column and pelvis imply a response to treatment. (b) Serial whole spine sagittal T1W and T2W images. Reduced signal intensity of several vertebral body lesions on T2W imaging on treatment indicates reduced water content and increasing sclerosis of lesions (arrows) consistent with therapy response. (c) Axial b900 (left column) and ADC maps (right column) through the pelvis show reducing signal intensity after therapy of the sacral lesion and of the left iliac lesion (arrows) after therapy. ADC values remain essentially unchanged (left iliac lesion: November 2010, mean 1168 μm2/s (SD 243); March 2011, mean ADC 1164 μm2/s (SD 200); January 2011, mean ADC 1134 μm2/s (SD 137); June 2011, mean ADC 1192 μm2/s (SD 247)).
Figure 6
Figure 6
Clinical response with decreases in signal intensity on high b-value images and unchanged ADC values. A 60-year-old woman with metastatic breast cancer treated with capecitabine and bisphosphonates. (a) Serial b900 3D-MIP (inverted scale) images. Scans at intervals of approximately 2–3 months after therapy. Reductions in signal intensity in the majority of lesions within the vertebral column and pelvis imply a response to treatment. (b) Serial whole spine sagittal T1W and T2W images. Reduced signal intensity of several vertebral body lesions on T2W imaging on treatment indicates reduced water content and increasing sclerosis of lesions (arrows) consistent with therapy response. (c) Axial b900 (left column) and ADC maps (right column) through the pelvis show reducing signal intensity after therapy of the sacral lesion and of the left iliac lesion (arrows) after therapy. ADC values remain essentially unchanged (left iliac lesion: November 2010, mean 1168 μm2/s (SD 243); March 2011, mean ADC 1164 μm2/s (SD 200); January 2011, mean ADC 1134 μm2/s (SD 137); June 2011, mean ADC 1192 μm2/s (SD 247)).
Figure 7
Figure 7
Disease progression with decreases in signal intensity on high b-value images and unchanged ADC values. A 52-year-old man with metastatic prostate cancer treated with docetaxol. (a) b900 3D-MIP (inverted scale), whole spine sagittal T1W and T2W sequences and sagittal reconstructed CT images before therapy. There is widespread lytic and sclerotic bony disease throughout the spine. Metastatic disease involving the pelvis, spine, proximal femora and scapulae are seen. Marked spinal canal narrowing at L1 also. (b) b900 3D-MIP (inverted scale), whole spine sagittal T1W and T2W sequences and sagittal reconstructed CT images 4 months after treatment. Decreases in signal intensity are seen in the majority of lesions on b900 images and increasing bony marrow infiltration on T1W scans. Increasing sclerosis within the vertebral bodies is seen on the CT images. (c) Right scapular images before therapy. Top row: axial STIR, T1W and CT. Bottom row: axial ADC map, b900 and volume-rendered CT image. Metastatic disease involving the right scapula causes bony expansion. The periphery of the lesion is highly cellular (high signal intensity on b900 image and low ADC (mean ADC 1247 μm2/s (SD 263)) with central necrosis. The lesion shows some calcification on the CT images. (d) Right scapular images before therapy 4 months after therapy. Top row: axial STIR, T1W and CT. Bottom row: axial ADC map, b900 and volume-rendered CT image. Reductions in signal intensity on b900 images with unchanging ADC map appearances (mean ADC 1230 μm2/s (SD 403)). The CT study clearly demonstrates increasingly dense calcification of the scapular lesion and bony expansion, indicating sclerotic progression of disease.
Figure 7
Figure 7
Disease progression with decreases in signal intensity on high b-value images and unchanged ADC values. A 52-year-old man with metastatic prostate cancer treated with docetaxol. (a) b900 3D-MIP (inverted scale), whole spine sagittal T1W and T2W sequences and sagittal reconstructed CT images before therapy. There is widespread lytic and sclerotic bony disease throughout the spine. Metastatic disease involving the pelvis, spine, proximal femora and scapulae are seen. Marked spinal canal narrowing at L1 also. (b) b900 3D-MIP (inverted scale), whole spine sagittal T1W and T2W sequences and sagittal reconstructed CT images 4 months after treatment. Decreases in signal intensity are seen in the majority of lesions on b900 images and increasing bony marrow infiltration on T1W scans. Increasing sclerosis within the vertebral bodies is seen on the CT images. (c) Right scapular images before therapy. Top row: axial STIR, T1W and CT. Bottom row: axial ADC map, b900 and volume-rendered CT image. Metastatic disease involving the right scapula causes bony expansion. The periphery of the lesion is highly cellular (high signal intensity on b900 image and low ADC (mean ADC 1247 μm2/s (SD 263)) with central necrosis. The lesion shows some calcification on the CT images. (d) Right scapular images before therapy 4 months after therapy. Top row: axial STIR, T1W and CT. Bottom row: axial ADC map, b900 and volume-rendered CT image. Reductions in signal intensity on b900 images with unchanging ADC map appearances (mean ADC 1230 μm2/s (SD 403)). The CT study clearly demonstrates increasingly dense calcification of the scapular lesion and bony expansion, indicating sclerotic progression of disease.

Similar articles

Cited by

References

    1. Abrams HL, Spiro R, Goldstein N. Metastases in carcinoma; analysis of 1000 autopsied cases. Cancer. 1950;3:74–85. doi: 10.1002/1097-0142(1950)3:1<74::AID-CNCR2820030111>3.0.CO;2-7. - DOI - PubMed
    1. Carlin BI, Andriole GL. The natural history, skeletal complications, and management of bone metastases in patients with prostate carcinoma. Cancer. 2000;88:2989–94. doi: 10.1002/1097-0142(20000615)88:12+<2989::AID-CNCR14>3.0.CO;2-Q. - DOI - PubMed
    1. Coleman RE. Clinical features of metastatic bone disease and risk of skeletal morbidity. Clin Cancer Res. 2006;12:6243s–9s. doi: 10.1158/1078-0432.CCR-06-0931. - DOI - PubMed
    1. Pavlakis N, Schmidt R, Stockler M. Bisphosphonates for breast cancer. Cochrane Database Syst Rev. 2005:CD003474. - PubMed
    1. Body JJ, Bartl R, Burckhardt P, et al. Current use of bisphosphonates in oncology. International Bone and Cancer Study Group. J Clin Oncol. 1998;16:3890–9. - PubMed

MeSH terms

Substances

LinkOut - more resources