. 2012 Feb 15;72(4):917-27.
doi: 10.1158/0008-5472.CAN-11-1620. Epub 2011 Dec 20.

Immune inhibitory molecules LAG-3 and PD-1 synergistically regulate T-cell function to promote tumoral immune escape

Affiliations

Immune inhibitory molecules LAG-3 and PD-1 synergistically regulate T-cell function to promote tumoral immune escape

Seng-Ryong Woo et al. Cancer Res. .

Abstract

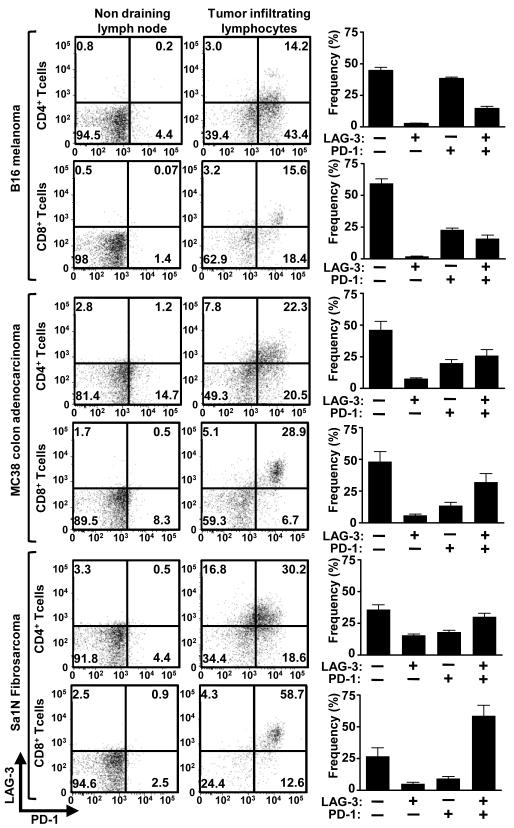
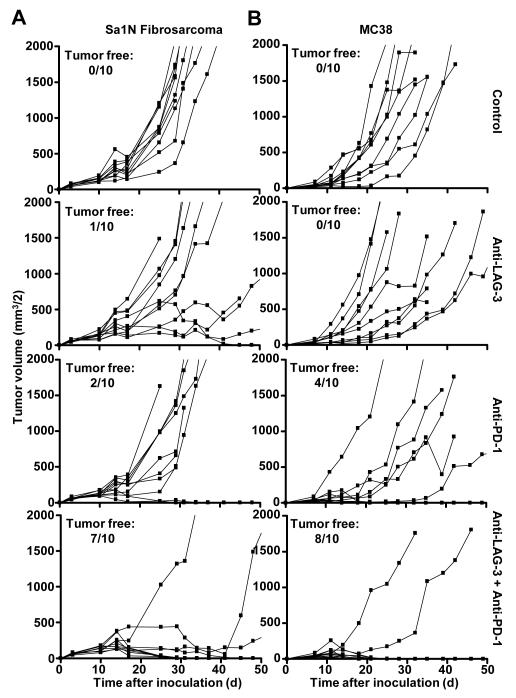
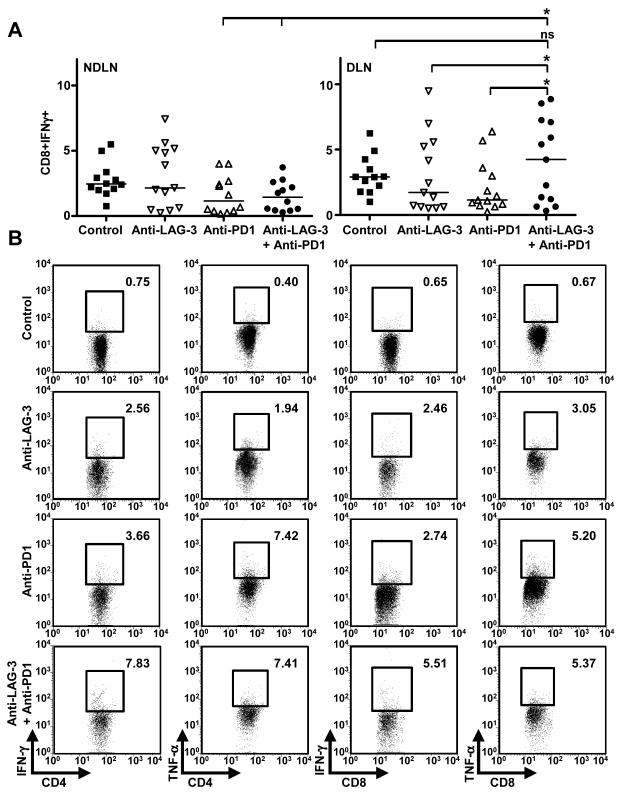
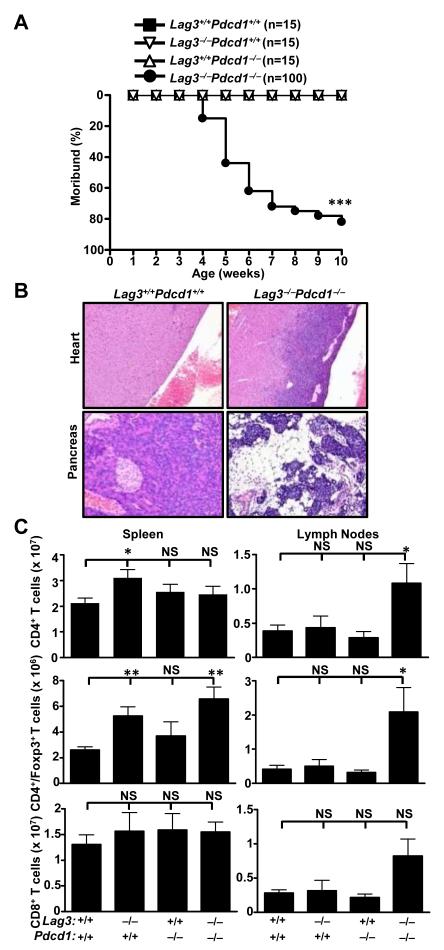
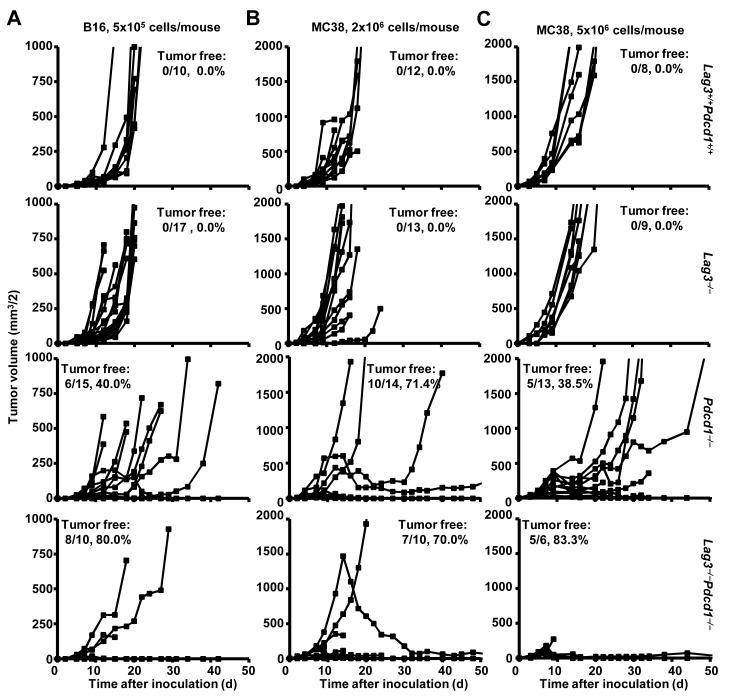
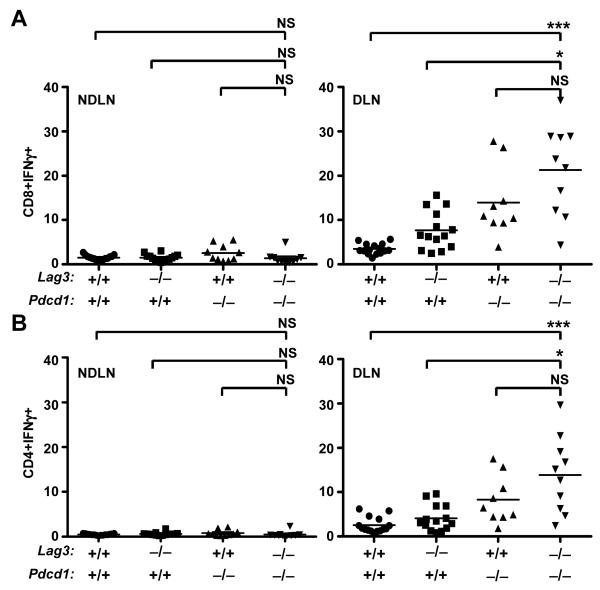
Inhibitory receptors on immune cells are pivotal regulators of immune escape in cancer. Among these inhibitory receptors, CTLA-4 (targeted clinically by ipilimumab) serves as a dominant off-switch while other receptors such as PD-1 and LAG-3 seem to serve more subtle rheostat functions. However, the extent of synergy and cooperative interactions between inhibitory pathways in cancer remain largely unexplored. Here, we reveal extensive coexpression of PD-1 and LAG-3 on tumor-infiltrating CD4(+) and CD8(+) T cells in three distinct transplantable tumors. Dual anti-LAG-3/anti-PD-1 antibody treatment cured most mice of established tumors that were largely resistant to single antibody treatment. Despite minimal immunopathologic sequelae in PD-1 and LAG-3 single knockout mice, dual knockout mice abrogated self-tolerance with resultant autoimmune infiltrates in multiple organs, leading to eventual lethality. However, Lag3(-/-)Pdcd1(-/-) mice showed markedly increased survival from and clearance of multiple transplantable tumors. Together, these results define a strong synergy between the PD-1 and LAG-3 inhibitory pathways in tolerance to both self and tumor antigens. In addition, they argue strongly that dual blockade of these molecules represents a promising combinatorial strategy for cancer.


Figures

Figure 1
Figure 1
Tumor-infiltrating lymphocytes express LAG-3 and PD-1. TILs were isolated from B16, MC38, and Sa1N tumors resected from WT mice 13 days post-inoculation (average sizes: B16=350mm3, MC38=1000mm3, Sa1N=750mm3) and stained for flow cytometric analysis. Representative data (left; gated on live CD4+ or CD8+ lymphocytes as indicated) or pooled data (right; n=8-10) of LAG-3/PD-1 expression on CD4+ or CD8+ TILs are shown.
Figure 2
Figure 2
Combinatorial anti-LAG-3/anti-PD-1 treatment inhibits tumor growth. Mice [(A) A/J; (B) C57BL/6] were randomized on (A) on day 6 when Sa1N fibrosarcoma tumor volumes were ~60 mm3/2, or (B) on day 7 when MC38 colon adenocarcinoma tumor volumes were ~40 mm3/2, and treated with isotype control, anti-PD-1, anti-LAG-3, or anti-PD-1/LAG-3 combination on days 8, 11 and 14 and tumor volume determined. Tumor growth inhibition (TGI) on day 18: (A) anti-LAG-3 - 18.9%; anti-PD-1 - 26.2%; anti-PD-1/LAG-3 - 77.3%. (B) anti-LAG-3 - 1%; anti-PD-1 - 55%; anti-PD-1/LAG-3 - 79%. Data represent 3 (Sa1N) or 4 (MC38) repeated experiments with 10 mice per group. Data were analyzed using the Maximum Likelihood method to determine synergy p values: (A) 0.0622 (for experiment shown; 0.0002 with all three experiments combined) and (B) 0.0455 (for experiment shown; 0.0366 with all four experiments combined) for the anti-PD-1/LAG-3 combinatorial treatment compared to anti-PD-1 and anti-LAG-3 treatments alone.
Figure 3
Figure 3
Combinatorial anti-LAG-3/anti-PD-1 treatment results in enhanced adaptive immune responses. Mice were inoculated on day 0 with 2×10⁶ MC38 cells s.c. in the right flank, euthanized at day 15, and tissues analyzed by flow cytometry. (A) Tumor draining inguinal (DLN) and non-draining brachial and axillary lymph nodes (NDLN) were isolated and activated with PMA + ionomycin for 4 h in the presence of brefeldin A, then analyzed by intracellular staining and flow cytometry (gated on lymphocytes). Nonparametric one-way ANOVA with Kruskal-Wallis test (p = 0.0074) was used for part A. (B) Tumor-infiltrating lymphocytes were analyzed by intracellular staining and flow cytometry; plots represent 5-8 animals per group. Numbers are percentage cytokine-positive infiltrating lymphocytes.
Figure 4
Figure 4
Lag3−/−Pdcd1−/− mice develop lethal systemic autoimmunity. (A) Disease incidence for Lag3−/−Pdcd1−/− mice, plus single knockout and WT littermate controls. Moribund curves were analyzed for statistical significance by logrank test- *** p<0.001. (B) Representative histopathology of the heart and pancreas of WT and Lag3−/−Pdcd1−/− mice. (C) Number of various T cell populations in the spleen and LNs (inguinal and brachial) is shown. Data represent three to four independent experiments with 4-7 mice total per group (5-7 weeks old). Error bars represent SEM - * p<0.05, ** p<0.01 (unpaired t-test).
Figure 5
Figure 5
Reduced tumor growth in tumor-bearing Lag3−/−Pdcd1−/− mice. WT, Lag3−/−, Pdcd1−/−, and Lag3−/−Pdcd1−/− mice were inoculated on day 0 with 5×10⁵ B16 cells i.d. (A), 2×10⁶ MC38 cells s.c. (B), or 5×10⁶ MC38 cells s.c. (C). Tumors were measured with an electronic caliper and reported as volume (see Methods). Data are combined from 2-3 repeated experiments, 3-5 animals per animals per group. Data were analyzed using the Maximum Likelihood method to determine synergy p values: (A) 0.0253, (B) 0.94, and (C) 0.0273 for the Lag3−/−Pdcd1−/− mice compared to the additive effect of the two single knockouts. Animals were euthanized when tumors became large, ulcerated, and/or necrotic.
Figure 6
Figure 6
Tumor-draining (right panel) and non-draining (left panel) LN T cells were isolated on day 14 post-B16 inoculation and were activated with PMA + ionomycin for 4 h in the presence of brefeldin A. After intracellular cytokine staining, CD8+IFN-γ+ (A) and CD4+IFN-γ+ (B) cells were analyzed by flow cytometry. Data are representative of 10-15 animals per group. Nonparametric one-way ANOVA with Kruskal-Wallis test (p < 0.0001) was used; symbols represent * p<0.05, ** p<0.01, and *** p<0.001 vs Lag3−/−Pdcd1−/−.

References

    1. Vesely MD, Kershaw MH, Schreiber RD, Smyth MJ. Natural innate and adaptive immunity to cancer. Annu Rev Immunol. 29:235–71. - PubMed
    1. Dunn GP, Bruce AT, Ikeda H, Old LJ, Schreiber RD. Cancer immunoediting: from immunosurveillance to tumor escape. Nat Immunol. 2002;3:991–8. - PubMed
    1. Leen AM, Rooney CM, Foster AE. Improving T cell therapy for cancer. Annu Rev Immunol. 2007;25:243–65. - PubMed
    1. Blackburn SD, Shin H, Haining WN, Zou T, Workman CJ, Polley A, et al. Coregulation of CD8+ T cell exhaustion by multiple inhibitory receptors during chronic viral infection. Nat Immunol. 2009;10:29–37. - PMC - PubMed
    1. Matsuzaki J, Gnjatic S, Mhawech-Fauceglia P, Beck A, Miller A, Tsuji T, et al. Tumor-infiltrating NY-ESO-1-specific CD8+ T cells are negatively regulated by LAG-3 and PD-1 in human ovarian cancer. Proc Natl Acad Sci U S A. 2010;107:7875–80. - PMC - PubMed

Publication types

MeSH terms