

Alterations in protein regulators of neurodevelopment in the cerebrospinal fluid of infants with posthemorrhagic hydrocephalus of prematurity
- PMID: 22186713
- PMCID: PMC3433889
- DOI: 10.1074/mcp.M111.011973
Alterations in protein regulators of neurodevelopment in the cerebrospinal fluid of infants with posthemorrhagic hydrocephalus of prematurity
Abstract
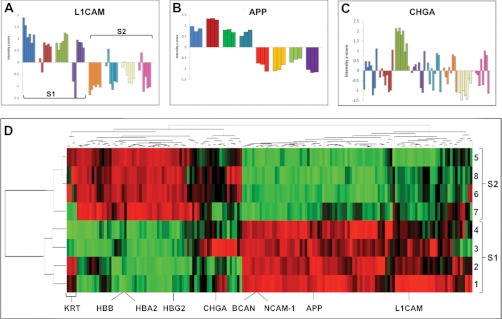
Neurological outcomes of preterm infants with posthemorrhagic hydrocephalus are among the worst in newborn medicine. There remains no consensus regarding the diagnosis or treatment of posthemorrhagic hydrocephalus, and the pathological pathways leading to the adverse neurological sequelae are poorly understood. In the current study, we developed an innovative approach to simultaneously identify potential diagnostic markers of posthemorrhagic hydrocephalus and investigate novel pathways of posthemorrhagic hydrocephalus-related neurological disability. Tandem multi-affinity fractionation for specific removal of plasma proteins from the hemorrhagic cerebrospinal fluid samples was combined with high resolution label-free quantitative proteomics. Analysis of cerebrospinal fluid obtained from infants with posthemorrhagic hydrocephalus demonstrated marked differences in the levels of 438 proteins when compared with cerebrospinal fluid from age-matched control infants. Amyloid precursor protein, neural cell adhesion molecule-L1, neural cell adhesion molecule-1, brevican and other proteins with important roles in neurodevelopment showed profound elevations in posthemorrhagic hydrocephalus cerebrospinal fluid compared with control. Initiation of neurosurgical treatment of posthemorrhagic hydrocephalus resulted in resolution of these elevations. The results from this foundational study demonstrate the significant promise of tandem multi-affinity fractionation-proteomics in the identification and quantitation of protein mediators of neurodevelopment and neurological injury. More specifically, our results suggest that cerebrospinal fluid levels of proteins such as amyloid precursor protein or neural cell adhesion molecule-L1 should be investigated as potential diagnostic markers of posthemorrhagic hydrocephalus. Notably, dysregulation of the levels these and other proteins may directly affect ongoing neurodevelopmental processes in these preterm infants, providing an entirely new hypothesis for the developmental disability associated with posthemorrhagic hydrocephalus.
Figures


Similar articles
-
Lumbar Cerebrospinal Fluid Biomarkers of Posthemorrhagic Hydrocephalus of Prematurity: Amyloid Precursor Protein, Soluble Amyloid Precursor Protein α, and L1 Cell Adhesion Molecule.Neurosurgery. 2017 Jan 1;80(1):82-90. doi: 10.1227/NEU.0000000000001415. Neurosurgery. 2017. PMID: 27571524 Free PMC article.
-
Tract-Specific Relationships Between Cerebrospinal Fluid Biomarkers and Periventricular White Matter in Posthemorrhagic Hydrocephalus of Prematurity.Neurosurgery. 2021 Feb 16;88(3):698-706. doi: 10.1093/neuros/nyaa466. Neurosurgery. 2021. PMID: 33313901 Free PMC article.
-
Cerebrospinal fluid NCAM-1 concentration is associated with neurodevelopmental outcome in post-hemorrhagic hydrocephalus of prematurity.PLoS One. 2021 Mar 10;16(3):e0247749. doi: 10.1371/journal.pone.0247749. eCollection 2021. PLoS One. 2021. PMID: 33690655 Free PMC article.
-
Biomarkers in neonatal posthemorrhagic hydrocephalus.Neonatology. 2012;101(1):1-7. doi: 10.1159/000323498. Epub 2011 Jul 27. Neonatology. 2012. PMID: 21791933 Free PMC article.
-
Current methods in the treatment of posthemorrhagic hydrocephalus in infants.Bratisl Lek Listy. 2003;104(11):347-51. Bratisl Lek Listy. 2003. PMID: 15055719 Review.
Cited by
-
The value of early and comprehensive diagnoses in a human fetus with hydrocephalus and progressive obliteration of the aqueduct of Sylvius: Case Report.BMC Neurol. 2016 Apr 11;16:45. doi: 10.1186/s12883-016-0566-7. BMC Neurol. 2016. PMID: 27067115 Free PMC article.
-
Immune activation during Paenibacillus brain infection in African infants with frequent cytomegalovirus co-infection.iScience. 2021 Mar 23;24(4):102351. doi: 10.1016/j.isci.2021.102351. eCollection 2021 Apr 23. iScience. 2021. PMID: 33912816 Free PMC article.
-
Multi-omic analysis elucidates the genetic basis of hydrocephalus.Cell Rep. 2021 May 4;35(5):109085. doi: 10.1016/j.celrep.2021.109085. Cell Rep. 2021. PMID: 33951428 Free PMC article.
-
Fingerprint changes in CSF composition associated with different aetiologies in human neonatal hydrocephalus: glial proteins associated with cell damage and loss.Fluids Barriers CNS. 2013 Dec 18;10(1):34. doi: 10.1186/2045-8118-10-34. Fluids Barriers CNS. 2013. PMID: 24351234 Free PMC article.
-
Lumbar Cerebrospinal Fluid Biomarkers of Posthemorrhagic Hydrocephalus of Prematurity: Amyloid Precursor Protein, Soluble Amyloid Precursor Protein α, and L1 Cell Adhesion Molecule.Neurosurgery. 2017 Jan 1;80(1):82-90. doi: 10.1227/NEU.0000000000001415. Neurosurgery. 2017. PMID: 27571524 Free PMC article.
References
-
- Volpe J. J. (2008) Neurology of the newborn, Elsevier, Philadelphia
Publication types
MeSH terms
Substances
Grants and funding
LinkOut - more resources
Full Text Sources
Medical
Research Materials
