. 2012 Jan;139(2):423-36.
doi: 10.1242/dev.075499.

Clonal and molecular analysis of the prospective anterior neural boundary in the mouse embryo

Affiliations

Clonal and molecular analysis of the prospective anterior neural boundary in the mouse embryo

Marieke Cajal et al. Development. 2012 Jan.

Abstract

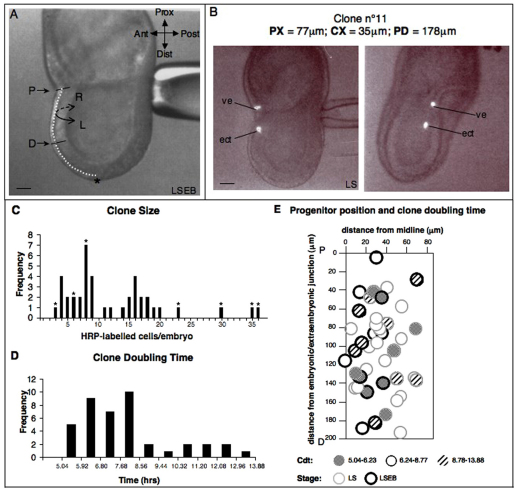
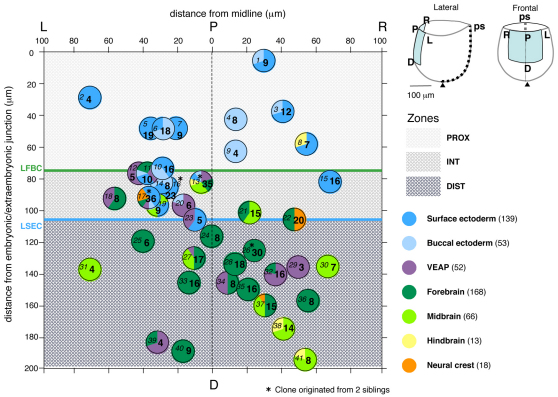
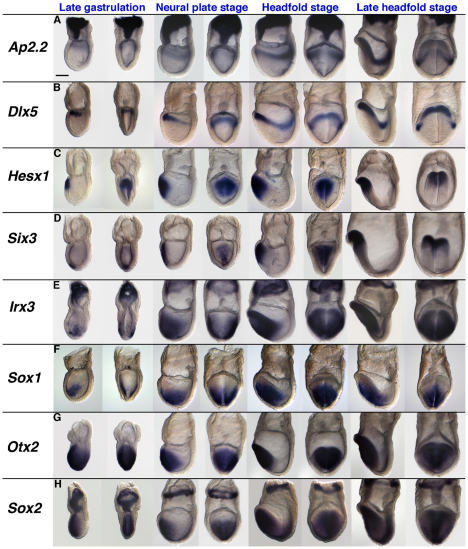
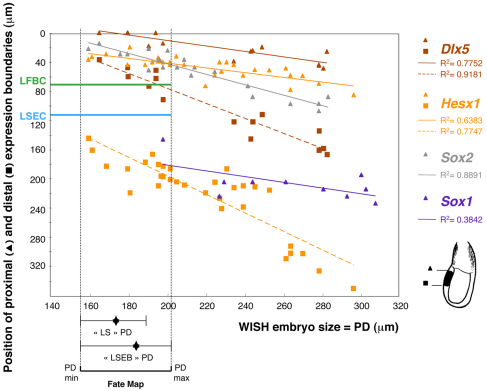
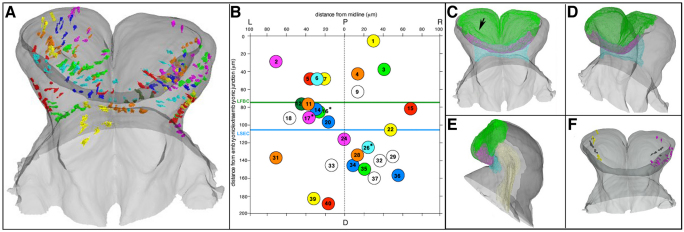
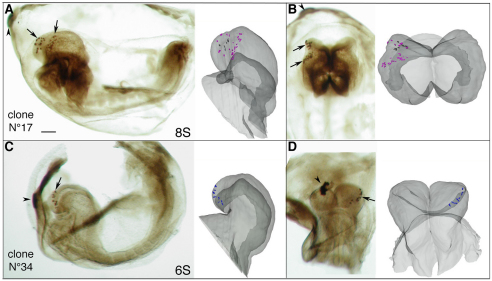
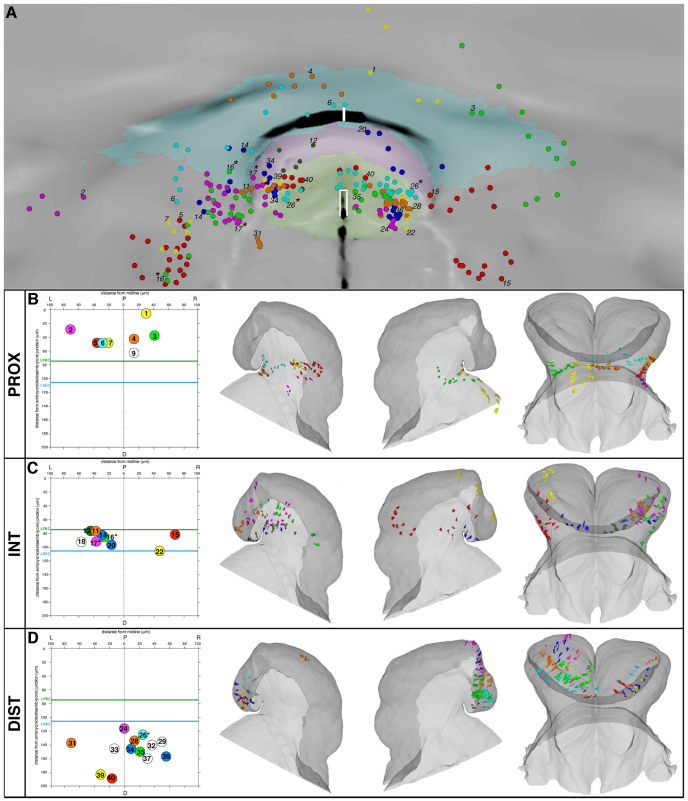
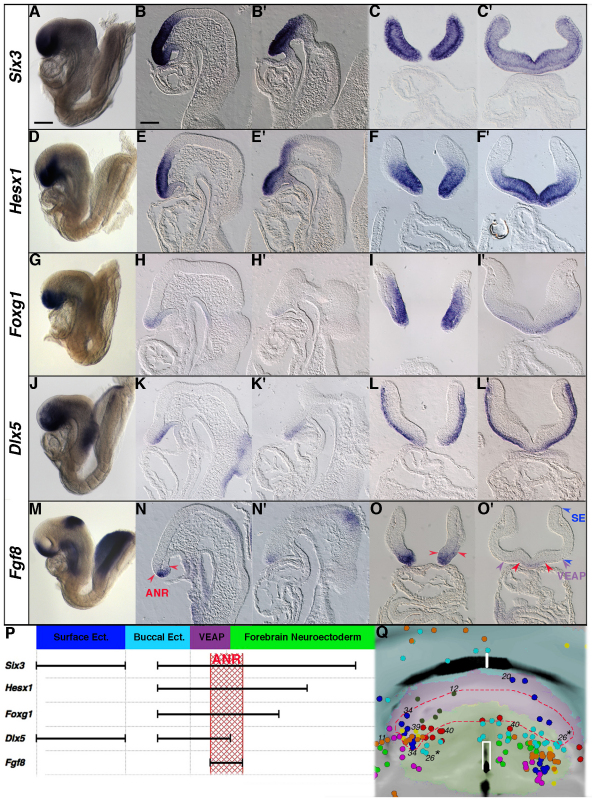
In the mouse embryo the anterior ectoderm undergoes extensive growth and morphogenesis to form the forebrain and cephalic non-neural ectoderm. We traced descendants of single ectoderm cells to study cell fate choice and cell behaviour at late gastrulation. In addition, we provide a comprehensive spatiotemporal atlas of anterior gene expression at stages crucial for anterior ectoderm regionalisation and neural plate formation. Our results show that, at late gastrulation stage, expression patterns of anterior ectoderm genes overlap significantly and correlate with areas of distinct prospective fates but do not define lineages. The fate map delineates a rostral limit to forebrain contribution. However, no early subdivision of the presumptive forebrain territory can be detected. Lineage analysis at single-cell resolution revealed that precursors of the anterior neural ridge (ANR), a signalling centre involved in forebrain development and patterning, are clonally related to neural ectoderm. The prospective ANR and the forebrain neuroectoderm arise from cells scattered within the same broad area of anterior ectoderm. This study establishes that although the segregation between non-neural and neural precursors in the anterior midline ectoderm is not complete at late gastrulation stage, this tissue already harbours elements of regionalisation that prefigure the later organisation of the head.


Figures

Fig. 1.
Fig. 1.
Clone initiation and clone expansion. (A) The region studied by clonal analysis extends along the anterior midline from the embryonic/extra-embryonic junction (P) to a point (D) halfway to the node (asterisk). Measurements along the sagittal contour of the ectoderm (white dotted line) gave a PD mean of 180±13 μm (±s.d.). Laterally, the injections encompassed 25% of the circumference of the ectoderm spanning the midline (curved arrows). The mean left-to-right distance (LR) was 192±40 μm. (B) Lateral (left) and frontal (right) views of a mouse embryo just after injection. Fluorescence marks the position of one ectoderm cell (ect) and one visceral extra-embryonic endoderm cell (ve). The coordinates of each injected ectoderm cell are defined by the longitudinal (PX) and the circumferential (CX) positions and the size of the embryo is shown by the PD value. The nominal error for PX is ± 5 μm and that for the retrospectively estimated CX is ± 25 μm (see Materials and methods). (C) Frequency distribution of the number of HRP-labelled cells per embryo (clone size) after 1 day of culture. Asterisks indicate that one clone originated from two siblings. (D) Frequency distribution of the clone doubling time (cdt). (E) cdt and initial developmental stage related to progenitor position. The origins of both abscissa and ordinate correspond to P. Left and right sides are superimposed. The fastest and slowest expanding clones (outside 99% confidence limits of the median) are indicated with shading and hatching, respectively. There is no obvious difference between the distribution of labelling sites in late streak (LS) and late streak/early bud (LSEB) stage embryos. Scale bars: 50 μm in A; 62 μm in B.
Fig. 2.
Fig. 2.
Histological sections showing HRP-labelled cells after 1 day of culture. (A,B) Parasagittal (A) and frontal (B) sections of cultured mouse embryos showing painted anatomical domains colonised at E8.5 (7- or 8-somite stage). (C-G) Longitudinal (D,E,G) and frontal (C,F) histological sections with examples of contribution to (C,D) surface ectoderm (dark-blue arrows), (D) buccal ectoderm (light-blue arrow), (E,F) forebrain neuroectoderm (green arrows), (F) emigrating neural crest cells at the level of the forebrain (orange arrows) and (G) ventral ectoderm of the anterior prosencephalon (VEAP; purple arrow). Scale bars: 25 μm in A; 30 μm in B.
Fig. 3.
Fig. 3.
Tissue contributions of descendant cells according to the original position of HRP-injected progenitors. Note that the plotted area has been derived from the curved basal surface of the ectoderm (see Fig. 1A) and, compared with a projection, is 7% greater in the proximodistal direction (most of the curvature being in the distal half of the embryo) and ∼11% in the left-right direction. The plotted area is represented in blue in the upper right schematics. The pie charts and colour codes show the relative composition of each clone to the nearest 10%. The centre of the circle corresponds to the position of the clone progenitor. The clone identification code (in italics) and total descendant number (in bold) are indicated. The green line marks the rostral limit of forebrain contribution (LFBC) and the blue line marks the caudal limit of surface ectoderm contribution (LSEC). The total number of HRP-labelled cells found in each derivative is in parentheses. Zones PROX, INT and DIST are described in the text.
Fig. 4.
Fig. 4.
Temporal and spatial expression of anterior regional markers and lineage-specific markers from LS to late headfold (LHF) stages. The expression patterns of (A) AP-2.2 (Tfap2c), (B) Dlx5, (C) Hesx1, (D) Six3, (E) Irx3, (F) Sox1, (G) Otx2 and (H) Sox2 are shown on lateral and frontal views (left and right, respectively, of each pair). Note that Six3 is first detected in the axial mesendoderm and the adjacent ectoderm cells (D). Scale bar: 170 μm.
Fig. 5.
Fig. 5.
Relationship between gene expression patterns and the prospective fate map. The distance from the embryonic/extra-embryonic junction of the proximal (triangles) and distal (squares) expression boundaries of Dlx5 (n=15 embryos) and Hesx1 (n=32) plotted against embryo size as reflected by PD, for LS to LB stages (see Fig. 1A). The positions of the proximal expression boundaries of Sox2 (n=20) and Sox1 (n=10) are also shown. Note that Sox1 expression is absent in younger embryos (PD<200 μm). Each point represents an individual embryo. Colour-coded lines represent the linear regression of each point set. Correlation coefficients indicate a significant statistical relationship between the gene expression boundaries and embryonic size (P<0.001). The PD mean and range values of the fate map experiment (horizontal dashed lines) and the positions of LFBC and LSEC are indicated (green and blue lines). Together, they delimit an area that corresponds to the INT zone, which is composed of mixed fate progenitors. Values were adjusted for 5.6% shrinkage in PD in the WISH-treated embryos.
Fig. 6.
Fig. 6.
Spatial distribution of the clones in a 3D reconstruction of the mouse embryo head. (A) Frontal view of all plotted clones in the extracted 3D surface of the ectoderm layer. (B) Proximodistal and left-right positions and colour-code for the progenitors of the clones displayed. White circles represent clones cited in the text but not plotted in the reconstruction. Asterisks indicate that one clone originated from two siblings. (C-E) Frontal (C), oblique (D) and left (E) views of the anatomical domains painted in the reconstruction: forebrain (green), VEAP (purple), buccal ectoderm (blue) and foregut endoderm (yellow). The arrow indicates the optic pit in the right headfold. (F) Representation of two plotted clones (clone 17 in magenta, clone 22 in yellow) contributing to emigrating neural crest cells (NCCs; grey-painted cells) at the forebrain level.
Fig. 7.
Fig. 7.
Whole-mount images of HRP-labelled mouse embryos and corresponding representation of the clones plotted in the 3D reconstruction. (A,B) Lateral (A) and dorsal (B) views of clone 17 at the 8-somite stage showing two distinct groups of labelled descendant cells (arrows) in the left headfold. Each group presumably derives from one of the documented siblings. (C,D) Lateral (C) and frontal (D) views of clone 34 at the 6-somite stage showing labelled descendants in the neuroectoderm and the VEAP of the left headfold (arrows). Arrowheads mark the descendants of the injected visceral endoderm cell. Scale bar: 130 μm.
Fig. 8.
Fig. 8.
Two-dimensional flat map and representation of clone dispersion. (A) Distribution of the painted clones and anatomical domains represented in a 2D flat map (dorsal view). Part of the whole 2D flat map (see supplementary material Fig. S3 for the whole flat map) has been magnified here. Anterior is at the top. Anatomical domains are only shown for prospective forebrain (green), VEAP (purple) and buccal ectoderm (blue). Clone identification and position at the time of labelling and associated colour code after 24 hours of culture are as in Fig. 6B. The white open-ended rectangle represents the midline position of the foregut and the white bar represents the position of the oral plate. (B-D) Clone spatial dispersions based on the PROX, INT and DIST zones that have been distinguished by their clonal composition. Rows show the spatial position and colour code of the plotted progenitors and then left, right and frontal views of the 3D reconstruction. Asterisks indicate that one clone originated from two siblings.
Fig. 9.
Fig. 9.
Molecular analysis of the non-neural and neural tissues forming the rostral end of the head. (A-O′) Whole-mount (A,D,G,J,M), parasagittal (B,E,H,K,N), sagittal (B′,E′,H′,K′,N′) and frontal (C,C′,F,F′,I,I′,L,L′,O,O′) histological sections of 5- to 7-somite stage embryos. (A-C′) Six3 is strongly expressed throughout the forebrain neuroectoderm, the VEAP, the buccal ectoderm and the surface ectoderm. (D-F′) Hesx1 is strongly expressed in the forebrain but weakly in the VEAP and the buccal ectoderm. (G-I′) Foxg1 is expressed in the forebrain, the VEAP and the buccal ectoderm. (J-L′) Dlx5 is expressed in the VEAP, the buccal ectoderm and the surface ectoderm. (M-O′) Fgf8 expression is found in the anterior neural ridge (ANR) and the isthmus at the midbrain-hindbrain level, in the buccal ectoderm at the level of the oral plate and in the foregut endoderm. The red arrowheads point to the boundary of the ANR as defined by Fgf8 expression domain. (O′) Purple and blue arrowheads delimit the VEAP and the surface ectoderm (SE) laterally. Note that Six3, Hesx1 Foxg1 and Dlx5 are expressed in the rostral portion of the buccal ectoderm (anterior to the oral plate). (P) Linear representation of the gene expression profiles and their overlapping domains at the 7-somite stage. The relative extent of the expression domains (black bars) estimated on histological sections is conserved, except for the surface ectoderm. The Fgf8 expression domain defines the ANR (hatched red box) encompassing part of the forebrain neuroectodem and the rostral part of the VEAP. (Q) The contribution of forebrain and VEAP clones to the ANR. The red dashed line encloses the fitted positions of the HRP-labelled cells scored as contributing to the ANR. Asterisks indicate that one clone originated from two siblings. Scale bars: 110 μm in A for whole-mount images; 60 μm in B for histological sections.

References

    1. Acampora D., Merlo G. R., Paleari L., Zerega B., Postiglione M. P., Mantero S., Bober E., Barbieri O., Simeone A., Levi G. (1999). Craniofacial, vestibular and bone defects in mice lacking the Distal-less-related gene Dlx5. Development 126, 3795-3809 - PubMed
    1. Acampora D., Postiglione M. P., Avantaggiato V., Di Bonito M., Simeone A. (2000). The role of Otx and Otp genes in brain development. Int. J. Dev. Biol. 44, 669-677 - PubMed
    1. Andoniadou C. L., Signore M., Sajedi E., Gaston-Massuet C., Kelberman D., Burns A. J., Itasaki N., Dattani M., Martinez-Barbera J. P. (2007). Lack of the murine homeobox gene Hesx1 leads to a posterior transformation of the anterior forebrain. Development 134, 1499-1508 - PMC - PubMed
    1. Ang S. L., Rossant J. (1993). Anterior mesendoderm induces mouse Engrailed genes in explant cultures. Development 118, 139-149 - PubMed
    1. Ang S. L., Conlon R. A., Jin O., Rossant J. (1994). Positive and negative signals from mesoderm regulate the expression of mouse Otx2 in ectoderm explants. Development 120, 2979-2989 - PubMed

Publication types