

Patterns and trends of beverage consumption among children and adults in Great Britain, 1986-2009
- PMID: 22186747
- PMCID: PMC3310974
- DOI: 10.1017/S0007114511006465
Patterns and trends of beverage consumption among children and adults in Great Britain, 1986-2009
Abstract
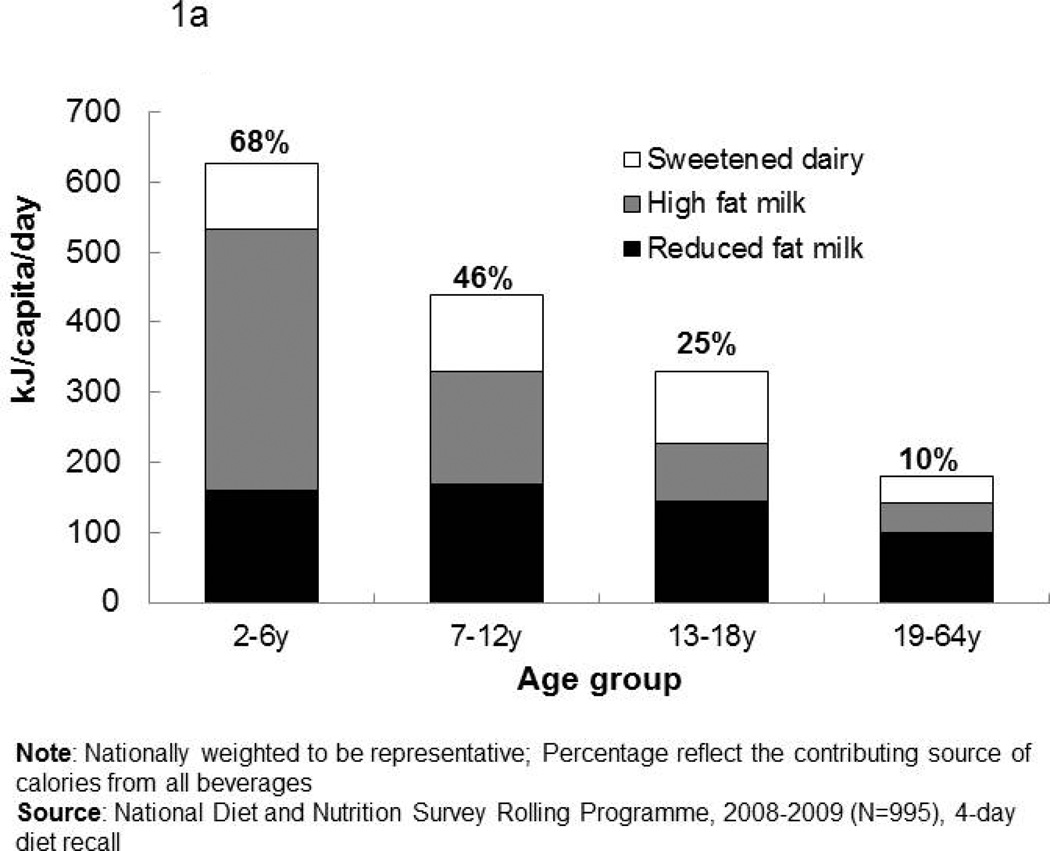
Many dietary recommendations include reduction of excessive intake of sugar-sweetened beverages (SSB) and other energy-rich beverages such as juices and alcohol. The present study examines surveys of both individual dietary intake data and household food expenditure surveys to provide a picture of patterns and trends in beverage intake and purchases in Great Britain from 1986 to 2009, and estimates the potential for pricing policy to promote more healthful beverage purchase patterns. In 2008-9, beverages accounted for 21, 14 and 18 % of daily energy intake for children aged 1·5-18 and 4-18 years, and adults (19-64 years), respectively. Since the 1990s, the most important shifts have been a reduction in consumption of high-fat dairy products and an increased consumption of fruit juices and reduced-fat milk among preschoolers, children and adolescents. Among adults, consumption of high-fat milk beverages, sweetened tea and coffee and other energy-containing drinks fell, but reduced-fat milk, alcohol (particularly beer) and fruit juice rose. In testing taxation as an option for shifting beverage purchase patterns, we calculate that a 10 % increase in the price of SSB could potentially result in a decrease of 7·5 ml/capita per d. A similar 10 % tax on high-fat milk is associated with a reduction of high-fat milk purchases by 5 ml/capita per d and increased reduced-fat milk purchase by 7 ml/capita per d. This analysis implies that taxation or other methods of shifting relative costs of these beverages could be a way to improve beverage choices in Great Britain.
Conflict of interest statement
The authors have no conflicts of interest to report.
Figures


Comment in
-
Why soft drink taxes will not work.Br J Nutr. 2012 Aug;108(3):395-6. doi: 10.1017/S0007114511006477. Epub 2011 Dec 20. Br J Nutr. 2012. PMID: 22186800 No abstract available.
References
-
- NHSI Center, editor. NHS. Health Survey for England - 2009 trend tables. Joint Health Surveys Unit; 2010.
-
- WHO. Obesity: Preventing and Managing the Global Epidemic. Geneva: World Health Organization; 2000. - PubMed
-
- WHO/FAO. Expert Consultation on Diet, Nutrition and the Prevention of Chronic DiseasesReport of the joint WHO/FAO expert consultation. Geneva: World Health Organization; 2003.
-
- Kopelman P. Symposium 1: Overnutrition: consequences and solutions Foresight Report: the obesity challenge ahead. Proc Nutr Soc. 2009:1–6. - PubMed
-
- World Health Organization. Diet, nutrition, and the prevention of chronic diseases. WHO Technical Report Series. Geneva: World Health Organization; 2003. 2003. - PubMed
Publication types
MeSH terms
Substances
Grants and funding
LinkOut - more resources
Full Text Sources
