. 2011 Dec 20:2:599.
doi: 10.1038/ncomms1608.

Competition for FcRn-mediated transport gives rise to short half-life of human IgG3 and offers therapeutic potential

Affiliations
Free PMC article

Competition for FcRn-mediated transport gives rise to short half-life of human IgG3 and offers therapeutic potential

Nigel M Stapleton et al. Nat Commun. .
Free PMC article

Abstract

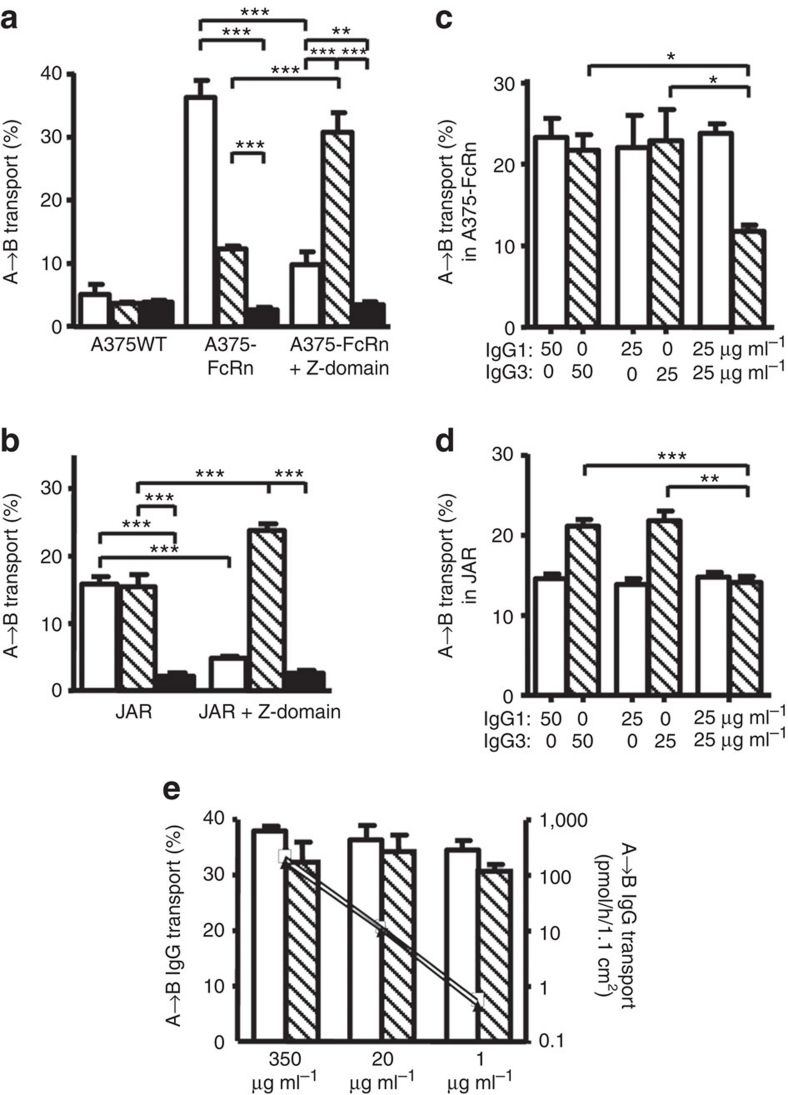
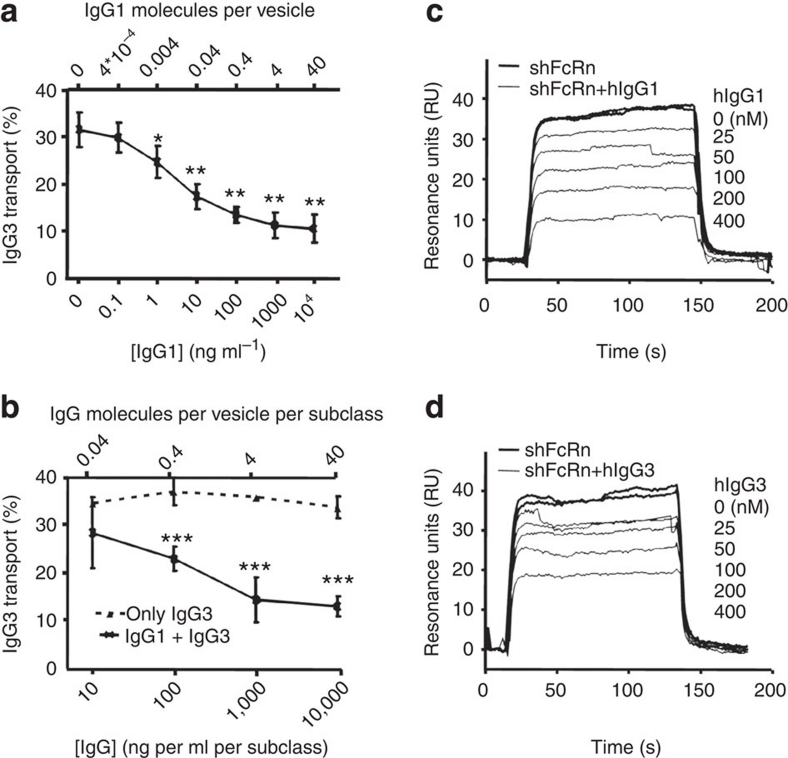
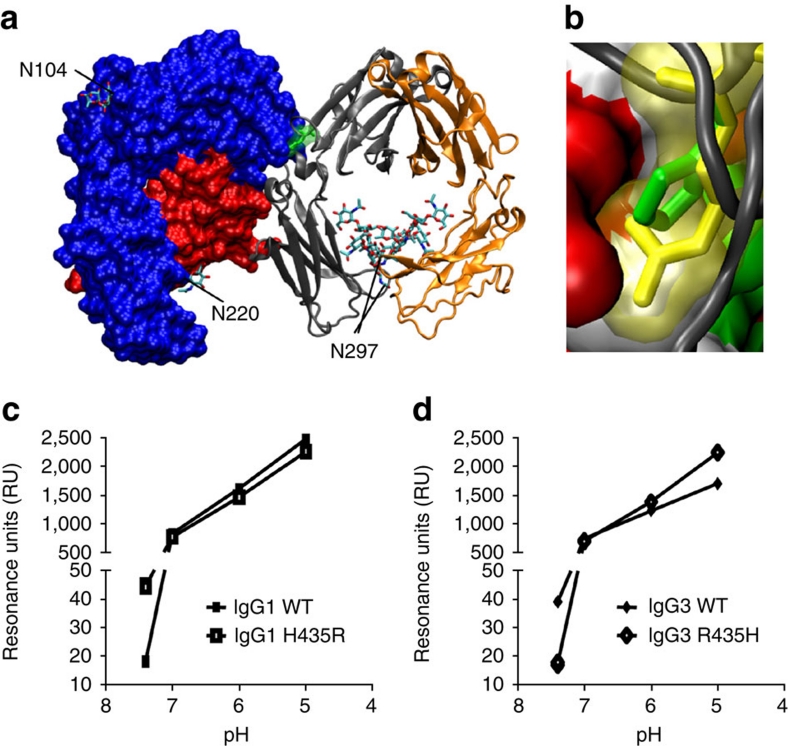
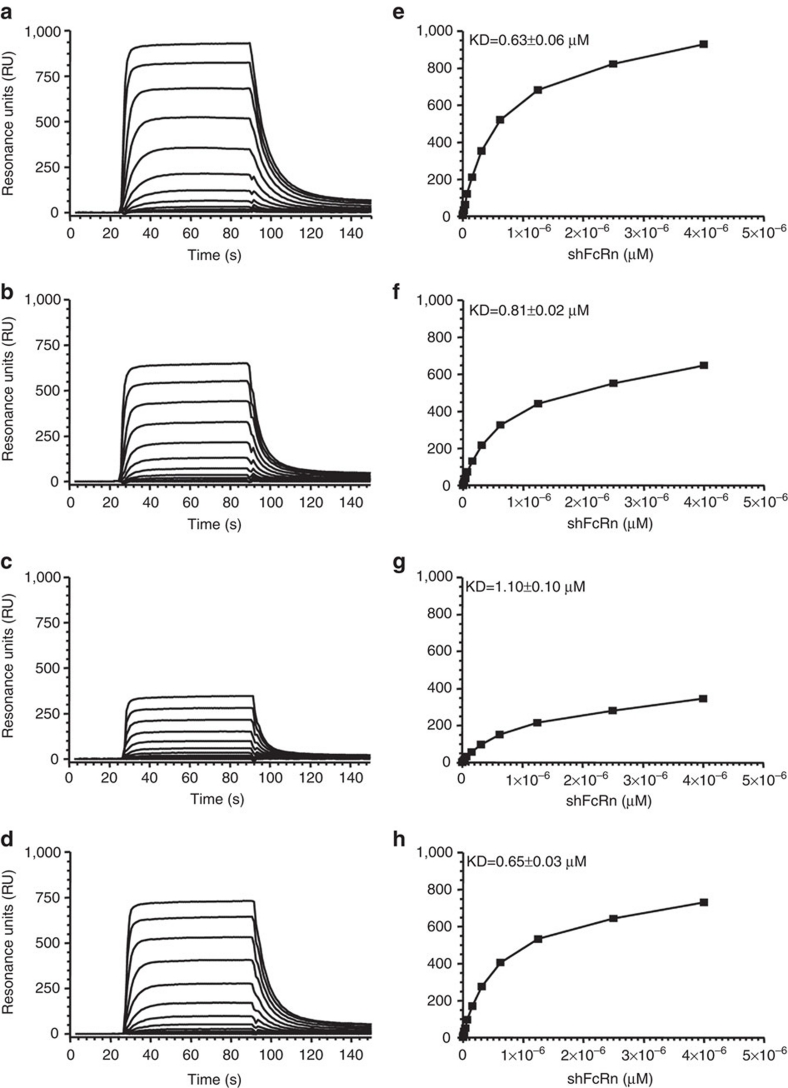
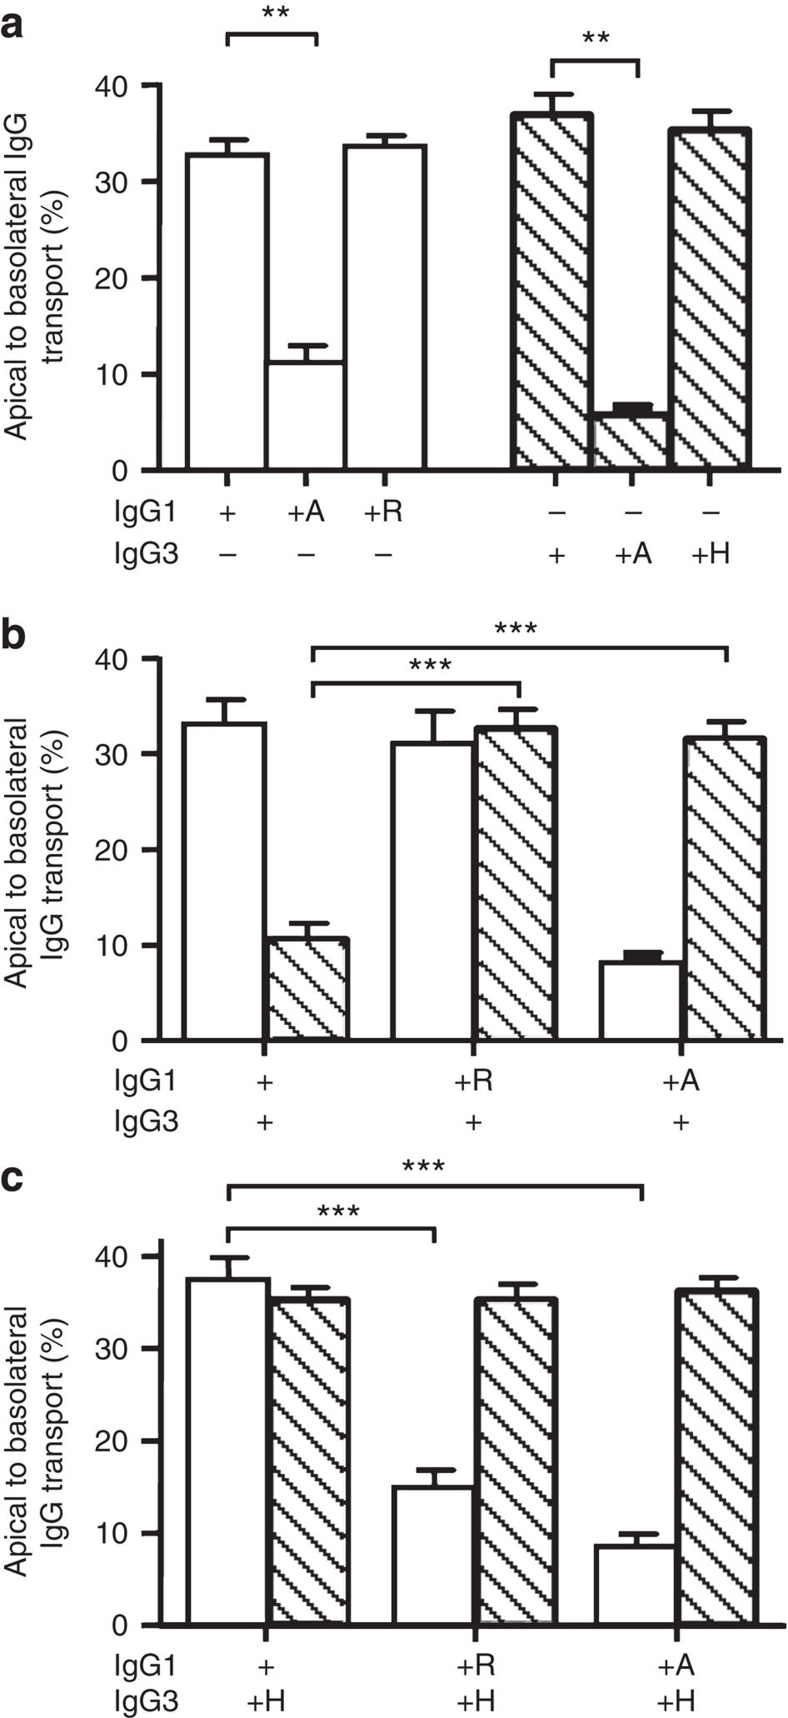
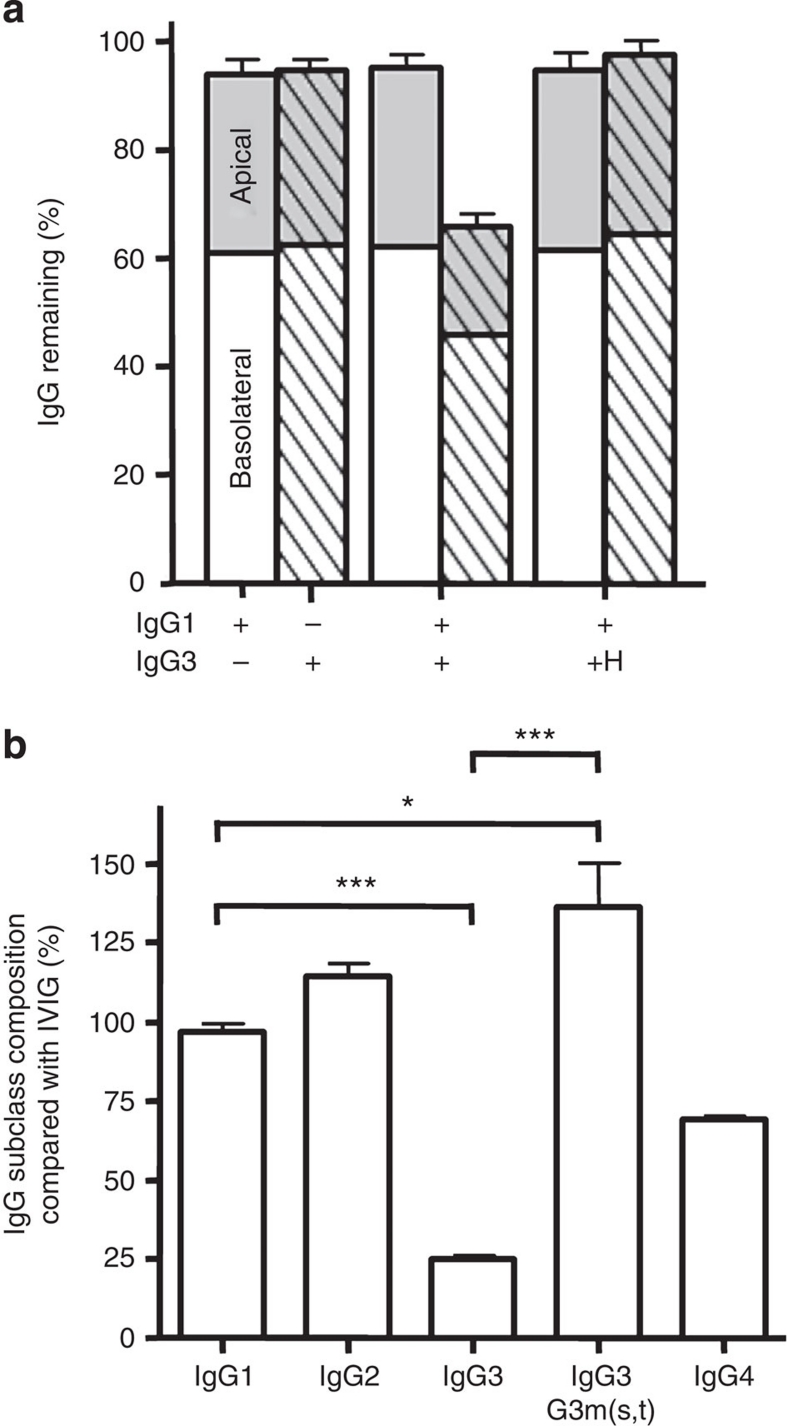
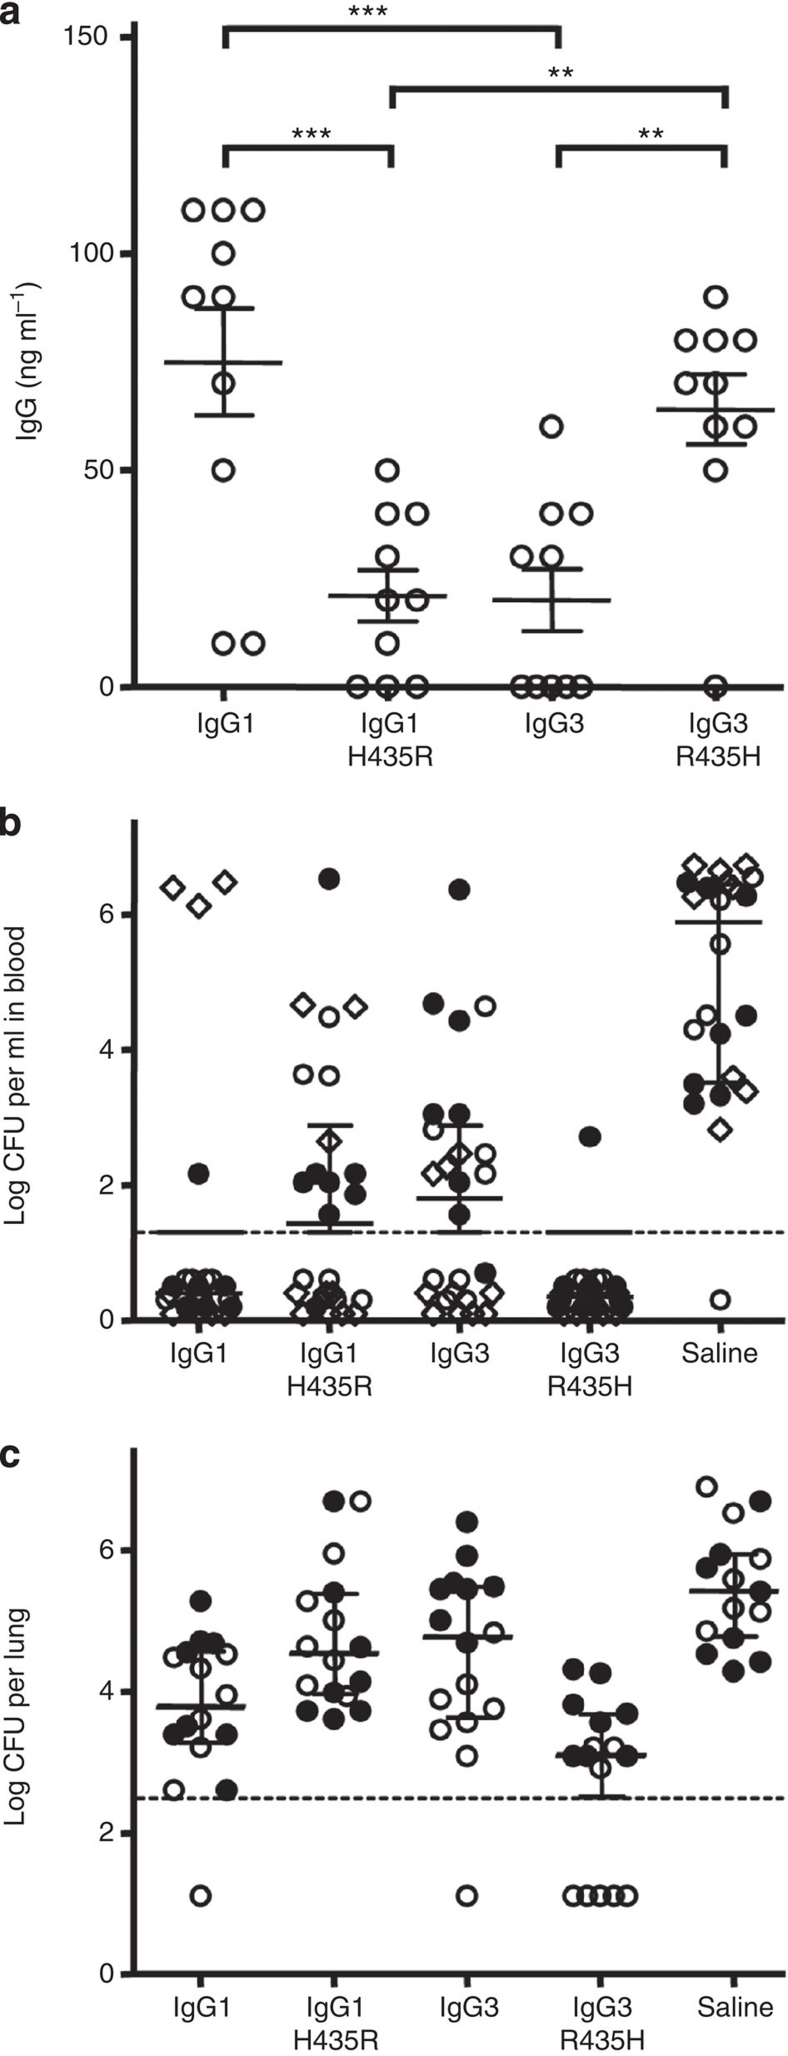
Human IgG3 displays the strongest effector functions of all IgG subclasses but has a short half-life for unresolved reasons. Here we show that IgG3 binds to IgG-salvage receptor (FcRn), but that FcRn-mediated transport and rescue of IgG3 is inhibited in the presence of IgG1 due to intracellular competition between IgG1 and IgG3. We reveal that this occurs because of a single amino acid difference at position 435, where IgG3 has an arginine instead of the histidine found in all other IgG subclasses. While the presence of R435 in IgG increases binding to FcRn at neutral pH, it decreases binding at acidic pH, affecting the rescue efficiency-but only in the presence of H435-IgG. Importantly, we show that in humans the half-life of the H435-containing IgG3 allotype is comparable to IgG1. H435-IgG3 also gave enhanced protection against a pneumococcal challenge in mice, demonstrating H435-IgG3 to be a candidate for monoclonal antibody therapies.


Figures

Figure 1
Figure 1. IgG3 transport is inhibited by IgG1 at non-saturating conditions.
All experiments were performed at pH 7.4. (a) FcRn-negative human A375-WT cells did not transcytose IgG1 (white) and IgG3 (hatched) from IVIg as transport was comparable to passive leakage (HRP, black). After transfection with the FcRn α-chain, A375–FcRn efficiently transported IgG from the apical to the basolateral compartment. When IVIg was mixed with Z-domain before transport at a 2:1 molar ratio (Z-domain:IgG) the IgG1 transport by A375–FcRn cells was significantly reduced, while IgG3 transport was enhanced. (b) JAR cells naturally expressing FcRn transported IgG1 and IgG3 from IVIg equally well. Incubation of IVIg with the Z-domain at a 2:1 molar ratio before transport inhibited transport of IgG1 but increased transport of IgG3. (c) Purified IgG3 and IgG1 were transcytosed equally well in A375–FcRn cells when transported separately, and neither inhibited its own transport when the input was doubled. Yet in 1:1 mixtures, IgG3 transport was reduced in the presence of IgG1. (d) In JAR cells, IgG3 was efficiently transported when offered alone. The amount of either IgG1 or IgG3 transported was also unaffected by doubling the apical concentration, but IgG3 transport was inhibited by the presence of equal amounts of IgG1. (e) When only one subclass was present, A375–FcRn transported a fixed percentage of IgG (left axis), while the absolute amount transported was diminished (IgG1 open squares, IgG3 triangles, right axis). Throughout, IgG1 is represented by open bars, IgG3 by hatched bars. 100 μg ml−1 IVIg was used in both (a,b). Apical to basolateral transport of myeloma IgG1 and IMIg-derived IgG3 in the concentration indicated in (ce). The Y-axis represents the percentage of IgG transported from the apical compartment to the basolateral compartment. The data represent mean and standard deviation from three independent experiments. Statistical comparison was performed by one-way ANOVA followed by Tukey's multiple comparison test in (a,b), and transport of IgG3, in the presence of IgG1, was compared with transport of IgG3 alone by two-tailed t-test in (c,d). *P≤0.05; **P≤0.01; ***P≤0.001.
Figure 2
Figure 2. Concentration-dependent inhibition of IgG3 transport by IgG1 owing to competitive binding to FcRn.
Apical to basolateral transport of V-gene matched recombinant IgG3 and IgG1. (a) IgG3 concentration was kept constant (10 μg ml−1) in the absence or presence of increasing amounts of IgG1. IgG3 transport was inhibited up to a plateau when more than 1 ng ml−1 IgG1 was present. All data points were compared with the samples without IgG1 by one-way ANOVA and Dunnett's multiple comparison test. (b) Recombinant IgG3 alone (dotted line) or mixed with IgG1 (solid line) at a 1:1 ratio in increasing concentrations were added to the apical compartment and IgG3 was measured in the basolateral compartment. At concentrations lower than 1 μg ml−1, transport of IgG3 increased up to levels similar to those observed when IgG3 is transported alone. All data points from mixed IgG1 and IgG3 transport in (b) were compared by t-test to the corresponding IgG3 transport without IgG1 present. The theoretical number of IgG molecules present in 1.25-μm-wide sorting endosomes described in ref. , assuming an equal concentration within these vesicles as present in the medium, is indicated on the secondary upper x-axis in (a,b). This arbitrary value is given as an indication only as these calculated values cannot take miscellaneously elongated or tubule-tethered vesicles into account (c,d). Surface plasma resonance analysis showing binding of 100-nM recombinant shFcRn to IgG3-immobilized CM5 biosensor chips (1,300 RU) at pH 6.0 in the presence of increasing concentrations of 25, 50, 100, 200 or 400-nM recombinant soluble IgG1 (c) or IgG3 (d). The data in (a,b) represent the mean and standard deviation. All experiments were repeated at least three times with similar results. *P≤0.05; **P≤0.01; ***P≤0.001.
Figure 3
Figure 3. The influence of the Histidine versus Arginine at position 435 on FcRn binding at different pH.
(a) The crystal structure of FcRn with IgG–Fc part, showing the orientation of the amino acid 435 of IgG in yellow. N-linked glycans are labelled according to their occurrence in FcRn and Fc. (b) A close-up showing the side chain of amino acid 435 of IgG (histidine, in green) in the binding pocket of FcRn. When arginine (present at this position in IgG3) was modelled into this position (yellow), it protrudes into the FcRn surface area (non-polar residues in white, positively charged amino acids in blue, negatively charged residues in red and polar residues in green), suggesting steric hindrance. Histidine at this position alters its charge at pH 6.5 and lower (positive charge, resulting in FcRn binding) versus neutral pH (no charge, resulting in release of IgG from FcRn). Arginine in this position, however, is positively charged at both low and neutral pH, possibly resulting in better binding of IgG3 at neutral pH. The crystallographic coordinates (accession 1I1A) were modelled using DeepView 4.03 (ref. 52) and VMD 1.9 (ref. 53). (c,d) The importance of this amino acid difference between IgG1 and IgG3 was tested biochemically by injecting 500 nM recombinant IgG over shFcRn-coupled CM5 sensor chips at different pH. IgG3 (d) bound FcRn better than IgG1 (c) at neutral pH, but the situation was reversed at acidic pH. IgG1–H435R mutant gained IgG3-like characteristics, binding better at neutral pH, but worse at low pH (c). Likewise, IgG3 behaved like IgG1 after replacing the R435 with H435, binding relatively worse at neutral pH, but better at low pH (d), confirming that two opposing factors (steric hindrance versus charge) may contribute to the observed inhibition by IgG1 on FcRn-mediated IgG3 transport. The data in (c,d) are presented as individual data points connecting the means from two independent injections with a line.
Figure 4
Figure 4. Binding of the IgG at pH 6.
0 is influenced by the amino acid at position 435. The different IgG variants (IgG1, IgG1–H435R, IgG3, or IgG3–R435H) were immobilized to CM5 sensor chips and shFcRn injected at different concentrations (7–4,000 nM represented by different lines) at pH 6.0. The sensorgrams are shown in the left panels (ad), and the corresponding equilibrium-binding responses versus shFcRn concentrations in the right panels (eh), for IgG1 (a,e), IgG1–H435R (b,f), IgG3 (c,g), or IgG3–R435H (d,h). The calculated affinity constants are superimposed in the right panels as derived from steady-state binding model using the BIAevaluation software. FcRn shows a reduced affinity to IgG1 at pH 6.0 after mutating the H at position 435 to R, and enhanced affinity to IgG3 after mutating the R at position 435 to H. The data are representative from two independent injections.
Figure 5
Figure 5. Inhibition of IgG3 transport by IgG1 is due to R435 in IgG3.
(a) Mutating the amino acid at position 435 in IgG1 (H435) and in IgG3 (R435) to an alanine reduces transport, while exchanging the histidine native to IgG1 and the arginine native to IgG3 on each others backbone had no effect on their transport rate when offered separately to FcRn-transfected A375 cells. (b) Whereas transport of IgG3-WT was inhibited in the presence of IgG1-WT, IgG1 bearing an alanine or an arginine at position 435 had no effect on IgG3 transport. (c) Transport of IgG3 with a histidine at position 435 was not inhibited by WT IgG1. When the amino acids found at position 435 in IgG1 and IgG3 were swapped, IgG1–H435R transport was inhibited by IgG3–R435H. (ac) ± indicate the presence or absence of IgG (10 μg ml−1 per subclass), IgG1 is represented by open bars, IgG3 by hatched bars. The presence of mutated variants (435H, 435A and 435R) is indicated by the corresponding letter. The data represent mean and standard deviation from three independent experiments. Transport of WT IgG was compared with transport of mutant IgG by one-way ANOVA with Dunnett's multiple comparison test and significance. **P≤0.01; ***P≤0.001.
Figure 6
Figure 6. H435-containing IgG3 has extended half-life in humans.
(a) Approximately 95% of the total IgG added to apical compartments of confluent A375–FcRn monolayers was recovered after 24 h from both the apical (grey) and the basolateral (white) compartments when the IgG1 (open bars) or IgG3 (hatched) were added individually (10 μg ml−1 per subclass). However, when the IgG1 and IgG3 were mixed in equal amounts, ∼65% of the initial IgG3 could be detected, suggesting IgG3 was degraded in the presence of IgG1. IgG1 recovery was similar to that found when no IgG3 was present. IgG3–R435H was not degraded in the presence of IgG1 as about 95% could be detected after 24 h, similarly to IgG3 alone. The data represent mean and standard deviation from three independent experiments. (b) The relative concentration of IgG subclasses and the histidine-435 containing IgG3 allotype G3m(s,t) in sera from agammaglobulinemic patients four weeks after their last treatment with IVIg compared with IgG subclass and G3m(s,t) levels found in the corresponding IVIg preparation. Data represent the average plus standard deviation calculated from at least three independent IgG subclass and allotype measurements performed on serum from three patients in (b). Statistical comparison was performed by one-way ANOVA followed by Tukey's multiple comparison test in (b). *P≤0.05; ***P≤0.001. For simplicity, significant differences are only displayed for IgG1 compared with all subclasses, and between IgG3 total and G3m(s,t) levels in (b).
Figure 7
Figure 7. H435-containing IgG3 has increased serum persistence in mice and protects against pneumococcal pneumonia.
(a) Serum IgG levels 48 h after injecting 1 μg the IgG variants into outbred NMRI mice. IgG1–H435R and IgG3 show lower serum levels than IgG1 and IgG3–R453H. **P≤0.01; ***P≤0.001. (b) Three and (c) two experiments, showing outbred NMRI mice (8–10 per group per experiment) that were passively immunized intraperitoneally with 3 μg (circles symbols) or 1 μg (diamond) recombinant IgG anti-Streptococcus pneumoniae 6 or placebo 48 h before challenge with pneumococci of serotype 6A. Results from individual experiments are shown using the same symbol throughout (open or closed circles and diamonds). The number of bacteria found in (b) blood and (c) lungs 24 h after challenge are shown. (b) All but one mouse in the control group developed bacteremia, while all but four mice receiving WT IgG1 and all but one mouse receiving IgG3–R435H were completely protected. Approximately half of the mice receiving either IgG1–H435R or WT IgG3 developed bacteremia. (c) High numbers of bacteria were found in the lungs of control mice. All IgG-treated mice were significantly protected from lung infection, with lowered level of bacterial burden, with few mice in each group completely protected with no detectable bacteria. IgG3–R435H protected the mice significantly better than all other IgG variants, with five mice without detectable lung or blood infection. The dotted lines indicate the level of detection. Data in (a) represent the IgG levels in individual mice together with means and standard errors of means; data in (b,c) represent the bacterial load of individual mice together with medians (assuming the level of detection for individuals without detectable bacteria) and interquartile ranges, statistical comparison is tabulated in Table 1.

References

    1. Bruhns P. et al. Specificity and affinity of human Fcgamma receptors and their polymorphic variants for human IgG subclasses. Blood 113, 3716–3725 (2009). - PubMed
    1. Salfeld J. G. Isotype selection in antibody engineering. Nat. Biotechnol. 25, 1369–1372 (2007). - PubMed
    1. Natsume A. et al. Engineered antibodies of IgG1/IgG3 mixed isotype with enhanced cytotoxic activities. Cancer Res. 68, 3863–3872 (2008). - PubMed
    1. Jefferis R. Antibody therapeutics: isotype and glycoform selection. Expert Opin. Biol. Ther. 7, 1401–1413 (2007). - PubMed
    1. Morell A., Terry W. D. & Waldmann T. A. Metabolic properties of IgG subclasses in man. J. Clin. Invest. 49, 673–680 (1970). - PMC - PubMed

Publication types

MeSH terms