. 2012 Mar;137(3):303-17.
doi: 10.1007/s00418-011-0900-5. Epub 2011 Dec 21.

Chronic intermittent hypoxia induces local inflammation of the rat carotid body via functional upregulation of proinflammatory cytokine pathways

Affiliations

Chronic intermittent hypoxia induces local inflammation of the rat carotid body via functional upregulation of proinflammatory cytokine pathways

Siu-Yin Lam et al. Histochem Cell Biol. 2012 Mar.

Abstract

Maladaptive changes in the carotid body (CB) induced by chronic intermittent hypoxia (IH) account for the pathogenesis of cardiovascular morbidity in patients with sleep-disordered breathing. We postulated that the proinflammatory cytokines, namely interleukin (IL)-1β, IL-6 and tumor necrosis factor (TNF)-α, and cytokine receptors (IL-1r1, gp130 and TNFr1) locally expressed in the rat CB play a pathophysiological role in IH-induced CB inflammation. Results showed increased levels of oxidative stress (serum 8-isoprostane and nitrotyrosine in the CB) in rats with 7-day IH treatment resembling recurrent apneic conditions when compared with the normoxic control. Local inflammation shown by the amount of ED1-containing cells (macrophage infiltration) and the gene transcripts of NADPH oxidase subunits (gp91(phox) and p22(phox)) and chemokines (MCP-1, CCR2, MIP-1α, MIP-1β and ICAM-1) in the CB were significantly more in the hypoxic group than in the control. In addition, the cytokines and receptors were expressed in the lobules of chemosensitive glomus cells containing tyrosine hydroxylase and the levels of expressions were significantly increased in the hypoxic group. Exogenous cytokines elevated the intracellular calcium ([Ca(2+)](i)) response to acute hypoxia in the dissociated glomus cells. The effect of cytokines on the [Ca(2+)](i) response was significantly greater in the hypoxic than in the normoxic group. Moreover, daily treatment of IH rats with anti-inflammatory drugs (dexamethasone or ibuprofen) attenuated the levels of oxidative stress, gp91(phox) expression and macrophage infiltration in the CB. Collectively, these results suggest that the upregulated expression of proinflammatory cytokine pathways could mediate the local inflammation and functional alteration of the CB under chronic IH conditions.


Figures

Fig. 1
Fig. 1
Photomicrographs show negative immunostaining of the carotid body sections with blocking antigens for the liquid-phase preadsorption (upper panels). Sections in the lower panels were positively stained with immunofluorescence (see “Methodology” for details). Bar 50 μm
Fig. 2
Fig. 2
a Levels of total IPT in the serum of rats in IH and Nx for 3 (D3) and 7 days (D7). * p < 0.05 versus corresponding Nx (n = 4 for each group). b Protein expression of NTR in the CB of rats in IH and Nx for 3 (D3) and 7 days (D7). Data are presented in % positive immunostains with positive staining of NTR immunoreactivities. *p < 0.0005 versus corresponding Nx (n = 4 for each group). c Immunohistochemical localization of ED1 and TH in the CB of rats in IH and Nx for 3 (D3) and 7 days (D7). Distinct immunoreactivities for ED1 (red) were localized to the macrophages, while intense immunoreactivities for TH (green) were localized to the clusters of type I glomus cells in the CB. Bar 10 μm. The protein expressions of ED1 are presented in % positive immunostains with positive staining of ED1 immunoreactivities. *p < 0.05 versus corresponding Nx (n = 4 for each group). d RT-PCR analysis of the mRNA expression of the NADPH oxidase subunits (gp91phox and p22phox) in 7-day Nx and IH rat CB. The expected size of PCR products from gp91phox is 450 bp, p22phox is 275 bp and β-actin is 436 bp. The graph shows relative expressions of the NADPH oxidase subunits/β-actin mRNA (% of control). *p < 0.05 versus the corresponding Nx (n = 3 for each group). e RT-PCR analysis of the mRNA expression of chemokines in 7-day Nx and IH rat CB. The expected size of PCR products from MCP-1 is 396 bp, CCR2 is 409 bp, MIP-1α is 977 bp, MIP-1β is 1,100 bp, ICAM-1 is 413 bp and β-actin is 436 bp. The graph shows relative expressions of the chemokines/β-actin mRNA (% of control). *p < 0.005 versus the corresponding Nx (n = 7 for each group)
Fig. 3
Fig. 3
Protein expressions of a IL-1β and b IL-1r1 in the CB of rats in IH and Nx for 3 (D3) and 7 days (D7). Data are presented in % positive immunostains with positive staining of IL-1β and IL-1r1 immunoreactivities. *p < 0.0001 versus corresponding Nx (n = 4 for each group). Immunohistochemical co-localization of IL-1β and TH/IL-1r1 and TH in the CB of rats with 7-day IH treatment. Distinct immunoreactivities for c IL-1β and f IL-1r1 were localized to the glomus cell clusters (red) in the CB. d, g Intense immunoreactivities for TH were localized to the clusters of type I glomus cells (green) in the CB. Immunoreactivities for e IL-1β and h IL-1r1 were co-localized predominantly with that for TH in the cell clusters of the glomus cell (yellow) double immunostaining. Bar 10 μm. i RT-PCR analysis of the mRNA expression of IL-1β and IL-1r1 in 7-day Nx and IH rat CB. The expected size of PCR products from IL-1β is 100 bp, IL-1r1 is 100 bp and β-actin is 436 bp. The graph shows relative expressions of the IL-1β/β-actin or IL-1r1/β-actin mRNA (% of control). * p < 0.05 versus the corresponding Nx (n = 7 for each group)
Fig. 4
Fig. 4
Protein expressions of a IL-6 and b gp130 in the CB of rats in IH and Nx for 3 (D3) and 7 days (D7). Data are presented in % positive immunostains with positive staining of IL-6 and gp130 immunoreactivities. *p < 0.005 versus corresponding Nx (n = 4 for each group). Immunohistochemical co-localization of IL-6 and TH/gp130 and TH in the CB of rats with 7-day IH treatment. Distinct immunoreactivities for c IL-6 and f gp130 were localized to the glomus cell clusters (red) in the CB. d, g Intense immunoreactivities for TH were localized to the clusters of type I glomus cells (green) in the CB. Immunoreactivities for e IL-6 and h gp130 were co-localized predominantly with that for TH in the cell clusters of the glomus cells (yellow) double immunostaining. Bar 10 μm. i RT-PCR analysis of the mRNA expression of IL-6 and gp130 in 7-day Nx and IH rat CB. The expected size of PCR products from IL-6 is 509 bp, gp130 is 375 bp and β-actin is 436 bp. The graph shows relative expressions of the IL-6/β-actin or gp130/β-actin mRNA (% of control). * p < 0.005 versus the corresponding Nx (n = 7 for each group)
Fig. 5
Fig. 5
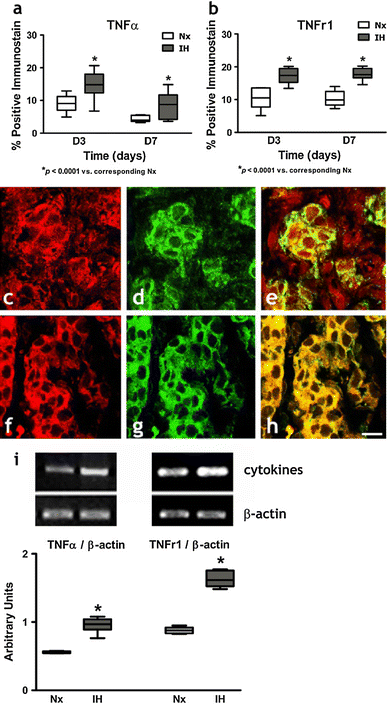
Protein expressions of a TNFα and b TNFr1 in the CB of rats in IH and Nx for 3 (D3) and 7 days (D7). Data are presented in % positive immunostains with positive staining of TNFα and TNFr1 immunoreactivities. * p < 0.0001 and # p < 0.005 versus corresponding Nx (n = 4 for each group). Immunohistochemical co-localization of TNFα and TH/TNFr1 and TH in the CB of rats with 7-day IH treatment. Distinct immunoreactivities for c TNFα and f TNFr1 were localized to the glomus cell clusters (red) in the CB. d, g Intense immunoreactivities for TH were localized to the clusters of type I glomus cells (green) in the CB. Immunoreactivities for e TNFα and h TNFr1 were co-localized predominantly with that for TH in the cell clusters of the glomus cell (yellow) double immunostaining. Bar 10 μm. i RT-PCR analysis of the mRNA expression of TNFα and TNFr1 in 7-day Nx and IH rat CB. The expected size of PCR products from TNFα is 276 bp, TNFr1 is 301 bp and β-actin is 436 bp. The graph shows relative expressions of the TNFα/β-actin or TNFr1/β-actin mRNA (% of control). * p < 0.005 versus the corresponding Nx (n = 7 for each group)
Fig. 6
Fig. 6
IL-1β increased [Ca2+]i response to acute hypoxia induced by perfusion of deoxygenated Ringer’s gassed with nitrogen balanced with 5% CO2 (Hx, 2 min) in dissociated glomus cells of the rat CB. Vehicle had no effect on the hypoxic response. IL-1β (0.1 nM) enhanced the [Ca2+]i response to Hx in a IH and b Nx. c IL-1β (0.01–1 nM) concentration dependently enhanced the peak [Ca2+]i responses to Hx. Treatment with excess antibody diminished the IL-1β-induced [Ca2+]i change. The [Ca2+]i response to Hx are presented as percent of the pretreatment control (% Control). * p < 0.05 versus the corresponding pretreatment control (n = 7 for each group). d The relative expression of IL-1β/vehicle (% of control) in Nx and IH. * p < 0.05 versus the corresponding Nx (n = 7 for each group)
Fig. 7
Fig. 7
IL-6 increased [Ca2+]i response to acute hypoxia induced by perfusion of deoxygenated Ringer’s gassed with nitrogen balanced with 5% CO2 (Hx, 2 min) in dissociated glomus cells of the rat CB. Vehicle had no effect on the hypoxic response. IL-6 (0.1 nM) enhanced the [Ca2+]i response to Hx in a IH and b Nx. c On average, IL-6 (0.01–1 nM) concentration dependently enhanced the peak [Ca2+]i responses to Hx. Treatment with excess antibody diminished the IL-6-induced [Ca2+]i change. The [Ca2+]i response to Hx are presented as percent of the pretreatment control (% Control). * p < 0.05 versus the corresponding pretreatment control (n = 7 for each group). d The relative expression of IL-6/vehicle (% of control) in Nx and IH. * p < 0.05 versus the corresponding Nx (n = 7 for each group)
Fig. 8
Fig. 8
TNFα increased [Ca2+]i response to acute hypoxia induced by perfusion of deoxygenated Ringer’s gassed with nitrogen balanced with 5% CO2 (Hx, 2 min) in dissociated glomus cells of the rat CB. Vehicle had no effect on the hypoxic response. TNFα (0.1 nM) enhanced the [Ca2+]i response to Hx in a IH and b Nx. c TNFα (0.01–1 nM) concentration dependently enhanced the peak [Ca2+]i responses to Hx. Treatment with excess antibody diminished the TNFα-induced [Ca2+]i change. The [Ca2+]i response to Hx are presented as percent of the pretreatment control (% Control). * p < 0.005 versus the corresponding pretreatment control (n = 7 for each group). d The relative expression of TNFα/vehicle (% of control) in Nx and IH. * p < 0.005 versus the corresponding Nx (n = 7 for each group)
Fig. 9
Fig. 9
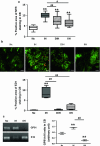
Effects of anti-inflammatory drugs on the levels of oxidative stress and local inflammation in the CB. a Protein expression of NTR in the CB of IH rats with or without treatment of dexamethasone (DIH) or ibuprofen (IIH). Data are presented in % positive immunostains with positive staining of NTR immunoreactivities. ** p < 0.005 versus the corresponding Nx; # <0.05, ## <0.005 versus the corresponding IH (n = 4 for each group). b Double-immunohistochemical localization of ED1 (red) and TH (green) in the CB of rats in Nx, IH, DIH and IIH groups. Bar 10 μm. The protein expressions of ED1 are presented in % positive immunostains with positive staining of ED1 immunoreactivities. ** p < 0.005 versus the corresponding Nx; ## <0.005 versus the corresponding IH (n = 4 for each group). c RT-PCR analysis of the mRNA expression of the NADPH oxidase subunit gp91phox (gp91) in the CB of Nx, IH and IIH groups. The graph shows relative expressions of gp91 and S16 mRNA level. The expected size of PCR product from S16 is 385 bp. ** p < 0.005 versus the corresponding Nx. # <0.05, ## <0.005 versus the corresponding IH (n = 3 for each group)

Similar articles

Cited by

References

    1. Barnes PJ, Karin M. Nuclear factor-kappaB: a pivotal transcription factor in chronic inflammatory diseases. N Engl J Med. 1997;336:1066–1071. doi: 10.1056/NEJM199704103361506. - DOI - PubMed
    1. Bonizzi G, Piette J, Schoonbroodt S, Greimers R, Havard L, Merville MP, Bours V. Reactive oxygen intermediate-dependent NF-kappaB activation by interleukin-1beta requires 5-lipoxygenase or NADPH oxidase activity. Mol Cell Biol. 1999;19:1950–1960. - PMC - PubMed
    1. Chandel NS, Schumacker PT. Cellular oxygen sensing by mitochondria: old questions, new insight. J Appl Physiol. 2000;88:1880–1889. doi: 10.1063/1.1303764. - DOI - PubMed
    1. Chin K, Nakamura T, Shimizu K, Mishima M, Nakamura T, Miyasaka M, Ohi M. Effects of nasal continuous positive airway pressure on soluble cell adhesion molecules in patients with obstructive sleep apnea syndrome. Am J Med. 2000;109:562–567. doi: 10.1016/S0002-9343(00)00580-5. - DOI - PubMed
    1. Clark RA, Valente AJ. Nuclear factor kappa B activation by NADPH oxidases. Mech Ageing Dev. 2004;125:799–810. doi: 10.1016/j.mad.2004.08.009. - DOI - PubMed

Publication types

MeSH terms