

Review
doi: 10.1102/1470-7330.2011.9007.
Integrating multiparametric prostate MRI into clinical practice
Affiliations
- PMID: 22187067
- PMCID: PMC3266575
- DOI: 10.1102/1470-7330.2011.9007
Item in Clipboard
Review
Integrating multiparametric prostate MRI into clinical practice
Cancer Imaging.
.
Abstract
Multifunctional magnetic resonance imaging (MRI) techniques are increasingly being used to address bottlenecks in prostate cancer patient management. These techniques yield qualitative, semi-quantitative and fully quantitative biomarkers that reflect on the underlying biological status of a tumour. If these techniques are to have a role in patient management, then standard methods of data acquisition, analysis and reporting have to be developed. Effective communication by the use of scoring systems, structured reporting and a graphical interface that matches prostate anatomy are key elements. Practical guidelines for integrating multiparametric MRI into clinical practice are presented.
Figures
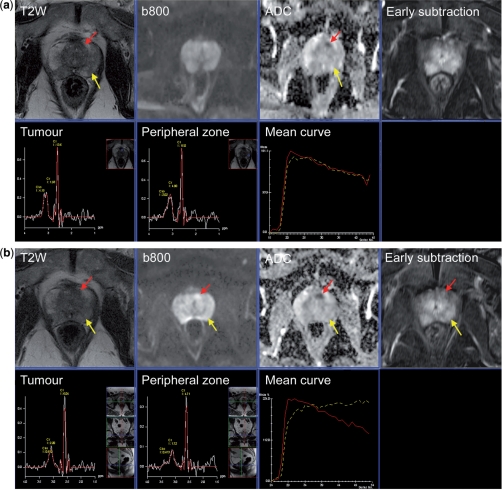
Communicating multifunctional MRI data at diagnosis and results of therapy monitoring. (a) A 67-year-old male with raised serum PSA (5.3 ng/ml). MRI scan before TRUS biopsy shows diffuse low signal intensity change in the peripheral zone bilaterally (yellow arrow) without focal features (T2-weighted score 3/5). The diffusion sequences show bilateral abnormalities on the high b-value image (b800 s/mm2) and ADC map (score 2/5) with no focal features. DCE-MRI early subtraction image shows diffuse enhancement with no focal features with washout curve (yellow line) (score 3/5). The MRSI image from the peripheral zone is normal (score 1/5). A small 6-mm tumour (red arrow) behind the anterior fibromuscular stroma is barely visible on T2-weighted images (2/5). The diffusion sequences are consistent with a focal tumour with an ADC value of 835 µm2/s (score 4/5). DCE-MRI shows the focal mass lesion which has a washout pattern (score 5/5). The MRSI is normal (1/5). Results of TRUS biopsy were small foci of Gleason 3 + 3 from the left side with prostatitis. It is clear that TRUS cannot sample the anterior gland tumour. The patient went onto an active surveillance program and received antibiotics for prostatitis. (b) Re-evaluation MRI after 1 year. The T2-weighted image again shows diffuse low signal intensity change in the peripheral zone bilaterally (yellow arrow) without focal features (T2-weighted score 3/5). The diffusion sequences show a bilateral abnormality on the b800 image and ADC map (score 2/5) with no focal features. DCE-MRI early subtraction image shows diffuse enhancement with no focal features but no washout is observed (yellow line) (score 2/5). The MRSI image from the peripheral zone remains normal (score 1/5). The anterior gland tumour has increased in size to 10 mm (T2-weighted score 3/5). The diffusion sequences show an enlarging tumour with an ADC value of 583 µm2/s (score 4/5). DCE-MRI shows a focal mass lesion with washout pattern (score 5/5). The MRSI remains normal (1/5). (c) Pictorial report of first year follow-up study (b) used to present the multifunctional MRI findings prior to template biopsy. Template biopsy of the left anterior lesion contained a 5-mm core of Gleason 3 + 4 cancer. Bilateral peripheral zone tumour foci (Gleason 3 + 3) were also seen. The patient opted for HIFU therapy of the anterior gland tumour. (d) Re-evaluation MRI after androgen deprivation therapy prior to HIFU therapy. The T2-weighted image shows prostate gland shrinkage. The T2-weighted image continues to show an abnormality at the site of the anterior gland lesion (score 3/5) which is not well seen on the DW image or ADC map (ADC 1355 µm2/s) (score 3/5). DCE-MRI show a plateau type curve at the location of the anterior tumour with a focal, asymmetric lesion still present (score 4/5) type. The peripheral zone shows slow washin only (score 1/5). There is marked metabolic atrophy on MRSI at both locations consistent with glandular atrophy induced by hormonal therapy.

Communicating multifunctional MRI data at diagnosis and results of therapy monitoring. (a) A 67-year-old male with raised serum PSA (5.3 ng/ml). MRI scan before TRUS biopsy shows diffuse low signal intensity change in the peripheral zone bilaterally (yellow arrow) without focal features (T2-weighted score 3/5). The diffusion sequences show bilateral abnormalities on the high b-value image (b800 s/mm2) and ADC map (score 2/5) with no focal features. DCE-MRI early subtraction image shows diffuse enhancement with no focal features with washout curve (yellow line) (score 3/5). The MRSI image from the peripheral zone is normal (score 1/5). A small 6-mm tumour (red arrow) behind the anterior fibromuscular stroma is barely visible on T2-weighted images (2/5). The diffusion sequences are consistent with a focal tumour with an ADC value of 835 µm2/s (score 4/5). DCE-MRI shows the focal mass lesion which has a washout pattern (score 5/5). The MRSI is normal (1/5). Results of TRUS biopsy were small foci of Gleason 3 + 3 from the left side with prostatitis. It is clear that TRUS cannot sample the anterior gland tumour. The patient went onto an active surveillance program and received antibiotics for prostatitis. (b) Re-evaluation MRI after 1 year. The T2-weighted image again shows diffuse low signal intensity change in the peripheral zone bilaterally (yellow arrow) without focal features (T2-weighted score 3/5). The diffusion sequences show a bilateral abnormality on the b800 image and ADC map (score 2/5) with no focal features. DCE-MRI early subtraction image shows diffuse enhancement with no focal features but no washout is observed (yellow line) (score 2/5). The MRSI image from the peripheral zone remains normal (score 1/5). The anterior gland tumour has increased in size to 10 mm (T2-weighted score 3/5). The diffusion sequences show an enlarging tumour with an ADC value of 583 µm2/s (score 4/5). DCE-MRI shows a focal mass lesion with washout pattern (score 5/5). The MRSI remains normal (1/5). (c) Pictorial report of first year follow-up study (b) used to present the multifunctional MRI findings prior to template biopsy. Template biopsy of the left anterior lesion contained a 5-mm core of Gleason 3 + 4 cancer. Bilateral peripheral zone tumour foci (Gleason 3 + 3) were also seen. The patient opted for HIFU therapy of the anterior gland tumour. (d) Re-evaluation MRI after androgen deprivation therapy prior to HIFU therapy. The T2-weighted image shows prostate gland shrinkage. The T2-weighted image continues to show an abnormality at the site of the anterior gland lesion (score 3/5) which is not well seen on the DW image or ADC map (ADC 1355 µm2/s) (score 3/5). DCE-MRI show a plateau type curve at the location of the anterior tumour with a focal, asymmetric lesion still present (score 4/5) type. The peripheral zone shows slow washin only (score 1/5). There is marked metabolic atrophy on MRSI at both locations consistent with glandular atrophy induced by hormonal therapy.

MRSI curve shape assessments. Representative spectra acquired at 3 T (no endorectal coil) with scores 1–5 (from left to right). Choline (Cho) + creatinine (Cr) to citrate (Ci) ratios of the individual spectra are given above each spectrum. The irregular line of each spectrum is the acquired data. The smooth lines are the corresponding fitted data from which the C + C/C ratio is calculated.
Similar articles
-
Interpretation and reporting multiparametric prostate MRI: a primer for residents and novices.Abdom Imaging. 2014 Oct;39(5):1036-51. doi: 10.1007/s00261-014-0097-x. Abdom Imaging. 2014. PMID: 24566965 Review.
-
[PI-RADS classification: structured reporting for MRI of the prostate].Rofo. 2013 Mar;185(3):253-61. doi: 10.1055/s-0032-1330270. Epub 2013 Feb 12. Rofo. 2013. PMID: 23404430 German.
-
Multiparametric magnetic resonance imaging in the detection of prostate cancer.Aktuelle Urol. 2014 Mar;45(2):119-26. doi: 10.1055/s-0034-1371875. Epub 2014 Apr 3. Aktuelle Urol. 2014. PMID: 24700068 Review.
-
Prostate MRI based on PI-RADS version 2: how we review and report.Cancer Imaging. 2016 Apr 11;16:9. doi: 10.1186/s40644-016-0068-2. Cancer Imaging. 2016. PMID: 27067275 Free PMC article.
-
Risk stratification of prostate cancer: integrating multiparametric MRI, nomograms and biomarkers.Future Oncol. 2016 Nov;12(21):2417-2430. doi: 10.2217/fon-2016-0178. Epub 2016 Jul 12. Future Oncol. 2016. PMID: 27400645 Free PMC article. Review.
Cited by
-
The "PROCAINA (PROstate CAncer INdication Attitudes) Project" (Part II)--a survey among Italian radiation oncologists on radical radiotherapy in prostate cancer.Radiol Med. 2013 Oct;118(7):1220-39. doi: 10.1007/s11547-013-0925-z. Epub 2013 May 27. Radiol Med. 2013. PMID: 23716281
-
Potential of hybrid ¹⁸F-fluorocholine PET/MRI for prostate cancer imaging.Eur J Nucl Med Mol Imaging. 2014 Sep;41(9):1744-55. doi: 10.1007/s00259-014-2786-7. Epub 2014 May 20. Eur J Nucl Med Mol Imaging. 2014. PMID: 24841413
-
Non-Invasive Prostate Cancer Characterization with Diffusion-Weighted MRI: Insight from In silico Studies of a Transgenic Mouse Model.Front Oncol. 2017 Dec 1;7:290. doi: 10.3389/fonc.2017.00290. eCollection 2017. Front Oncol. 2017. PMID: 29250485 Free PMC article.
-
Multiparametric MRI of prostate cancer: an update on state-of-the-art techniques and their performance in detecting and localizing prostate cancer.J Magn Reson Imaging. 2013 May;37(5):1035-54. doi: 10.1002/jmri.23860. J Magn Reson Imaging. 2013. PMID: 23606141 Free PMC article. Review.
-
Promise and pitfalls of quantitative imaging in oncology clinical trials.Magn Reson Imaging. 2012 Nov;30(9):1301-12. doi: 10.1016/j.mri.2012.06.009. Epub 2012 Aug 13. Magn Reson Imaging. 2012. PMID: 22898682 Free PMC article. Review.
References
-
- Villeirs GM, De Meerleer GO, De Visschere PJ, Fonteyne VH, Verbaeys AC, Oosterlinck W. Combined magnetic resonance imaging and spectroscopy in the assessment of high grade prostate carcinoma in patients with elevated PSA: a single-institution experience of 356 patients. Eur J Radiol. 2009;77:340–5. doi: 10.1016/j.ejrad.2009.08.007. - DOI - PubMed
Publication types
MeSH terms
LinkOut - more resources
Full Text Sources
Medical