

Remodeling of hepatic metabolism and hyperaminoacidemia in mice deficient in proglucagon-derived peptides
- PMID: 22187375
- PMCID: PMC3237648
- DOI: 10.2337/db11-0739
Remodeling of hepatic metabolism and hyperaminoacidemia in mice deficient in proglucagon-derived peptides
Abstract
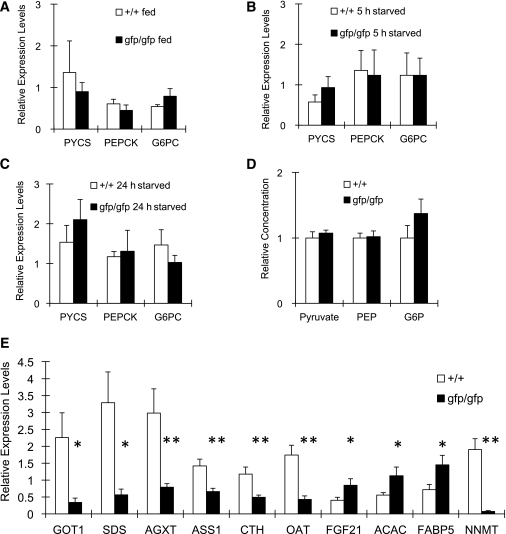
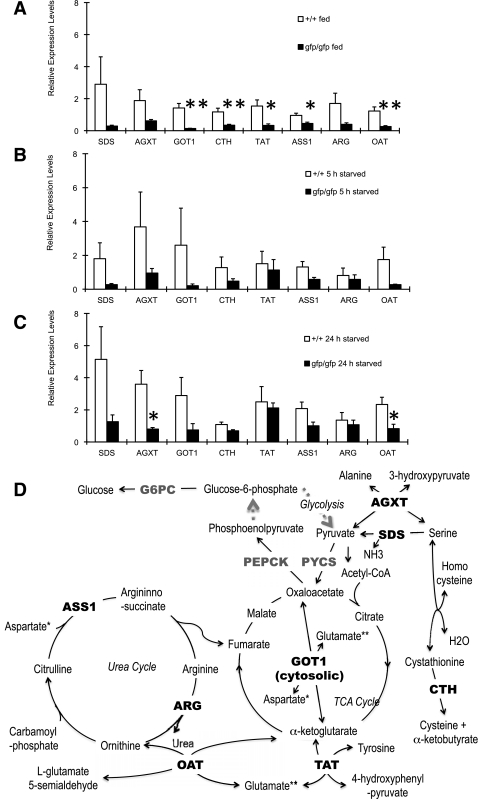
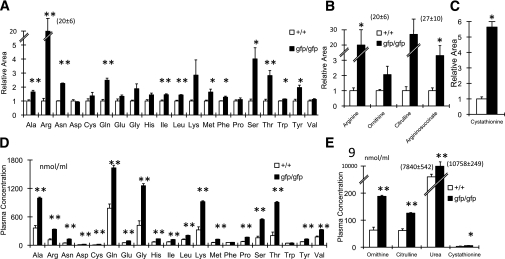
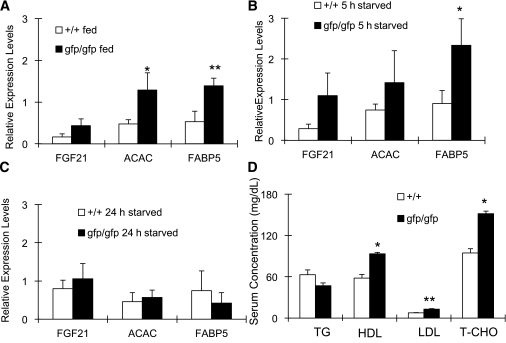
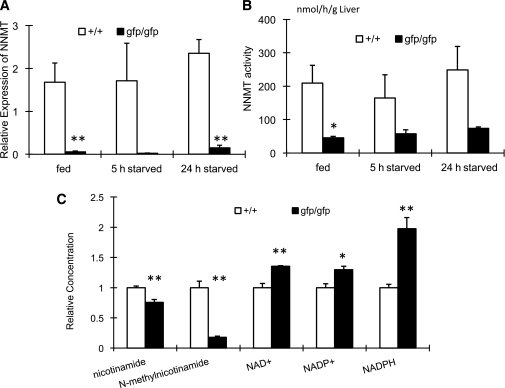
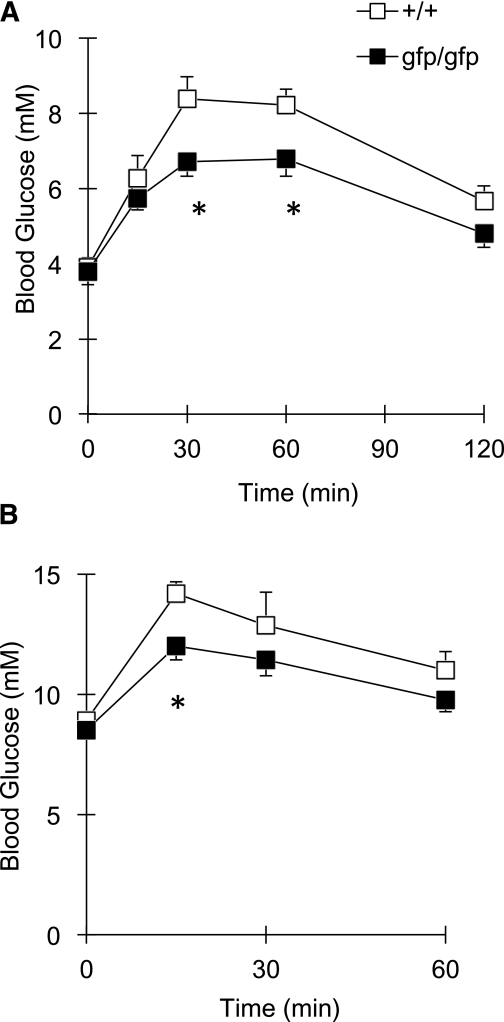
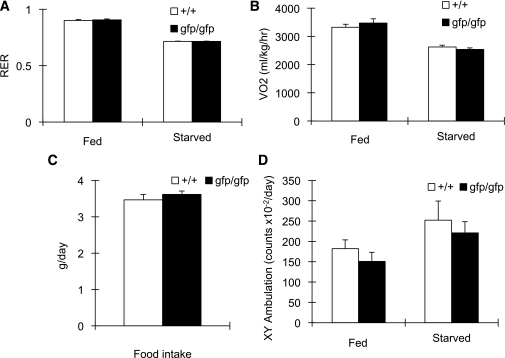
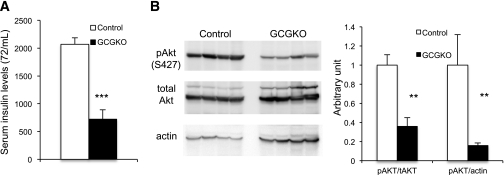
Glucagon is believed to be one of the most important peptides for upregulating blood glucose levels. However, homozygous glucagon-green fluorescent protein (gfp) knock-in mice (Gcg(gfp/gfp): GCGKO) are normoglycemic despite the absence of proglucagon-derived peptides, including glucagon. To characterize metabolism in the GCGKO mice, we analyzed gene expression and metabolome in the liver. The expression of genes encoding rate-limiting enzymes for gluconeogenesis was only marginally altered. On the other hand, genes encoding enzymes involved in conversion of amino acids to metabolites available for the tricarboxylic acid cycle and/or gluconeogenesis showed lower expression in the GCGKO liver. The expression of genes involved in the metabolism of fatty acids and nicotinamide was also altered. Concentrations of the metabolites in the GCGKO liver were altered in manners concordant with alteration in the gene expression patterns, and the plasma concentrations of amino acids were elevated in the GCGKO mice. The insulin concentration in serum and phosphorylation of Akt protein kinase in liver were reduced in GCGKO mice. These results indicated that proglucagon-derived peptides should play important roles in regulating various metabolic pathways, especially that of amino acids. Serum insulin concentration is lowered to compensate the impacts of absent proglucagon-derived peptide on glucose metabolism. On the other hand, impacts on other metabolic pathways are only partially compensated by reduced insulin action.
Figures
Similar articles
-
High Protein Diet Feeding Aggravates Hyperaminoacidemia in Mice Deficient in Proglucagon-Derived Peptides.Nutrients. 2022 Feb 25;14(5):975. doi: 10.3390/nu14050975. Nutrients. 2022. PMID: 35267952 Free PMC article.
-
Endogenous GIP ameliorates impairment of insulin secretion in proglucagon-deficient mice under moderate beta cell damage induced by streptozotocin.Diabetologia. 2016 Jul;59(7):1533-1541. doi: 10.1007/s00125-016-3935-2. Epub 2016 Apr 6. Diabetologia. 2016. PMID: 27053237 Free PMC article.
-
Impaired Fat Absorption from Intestinal Tract in High-Fat Diet Fed Male Mice Deficient in Proglucagon-Derived Peptides.Nutrients. 2024 Jul 14;16(14):2270. doi: 10.3390/nu16142270. Nutrients. 2024. PMID: 39064713 Free PMC article.
-
Metabolic impact of glucagon deficiency.Diabetes Obes Metab. 2011 Oct;13 Suppl 1:151-7. doi: 10.1111/j.1463-1326.2011.01456.x. Diabetes Obes Metab. 2011. PMID: 21824269 Review.
-
Central pre-proglucagon derived peptides: opportunities for treatment of obesity.Curr Pharm Des. 2003;9(17):1373-82. doi: 10.2174/1381612033454775. Curr Pharm Des. 2003. PMID: 12769729 Review.
Cited by
-
Interrupted Glucagon Signaling Reveals Hepatic α Cell Axis and Role for L-Glutamine in α Cell Proliferation.Cell Metab. 2017 Jun 6;25(6):1362-1373.e5. doi: 10.1016/j.cmet.2017.05.011. Cell Metab. 2017. PMID: 28591638 Free PMC article.
-
Late gestation fetal hyperglucagonaemia impairs placental function and results in diminished fetal protein accretion and decreased fetal growth.J Physiol. 2021 Jul;599(13):3403-3427. doi: 10.1113/JP281288. Epub 2021 May 10. J Physiol. 2021. PMID: 33878802 Free PMC article.
-
Paracrine signaling in islet function and survival.J Mol Med (Berl). 2020 Apr;98(4):451-467. doi: 10.1007/s00109-020-01887-x. Epub 2020 Feb 17. J Mol Med (Berl). 2020. PMID: 32067063 Free PMC article. Review.
-
Association of nicotinamide-N-methyltransferase mRNA expression in human adipose tissue and the plasma concentration of its product, 1-methylnicotinamide, with insulin resistance.Diabetologia. 2015 Apr;58(4):799-808. doi: 10.1007/s00125-014-3490-7. Epub 2015 Jan 18. Diabetologia. 2015. PMID: 25596852 Free PMC article. Clinical Trial.
-
The potential molecular mechanism underlying gypenoside amelioration of atherosclerosis in ApoE-/- mice: A multi-omics investigation.Heliyon. 2024 Apr 10;10(8):e29164. doi: 10.1016/j.heliyon.2024.e29164. eCollection 2024 Apr 30. Heliyon. 2024. PMID: 38644881 Free PMC article.
References
-
- Kieffer TJ, Habener JF. The glucagon-like peptides. Endocr Rev 1999;20:876–913 - PubMed
-
- Baggio LL, Drucker DJ. Biology of incretins: GLP-1 and GIP. Gastroenterology 2007;132:2131–2157 - PubMed
-
- Furuta M, Zhou A, Webb G, et al. Severe defect in proglucagon processing in islet A-cells of prohormone convertase 2 null mice. J Biol Chem 2001;276:27197–27202 - PubMed
Publication types
MeSH terms
Substances
LinkOut - more resources
Full Text Sources
Medical
Molecular Biology Databases
