. 2012 Feb 17;287(8):5600-14.
doi: 10.1074/jbc.M111.289843. Epub 2011 Dec 20.

Functional regulation of pre-B-cell leukemia homeobox interacting protein 1 (PBXIP1/HPIP) in erythroid differentiation

Affiliations

Functional regulation of pre-B-cell leukemia homeobox interacting protein 1 (PBXIP1/HPIP) in erythroid differentiation

Bramanandam Manavathi et al. J Biol Chem. .

Abstract

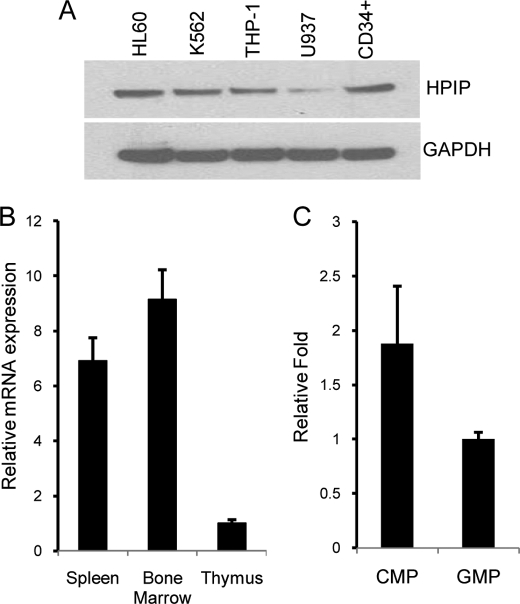
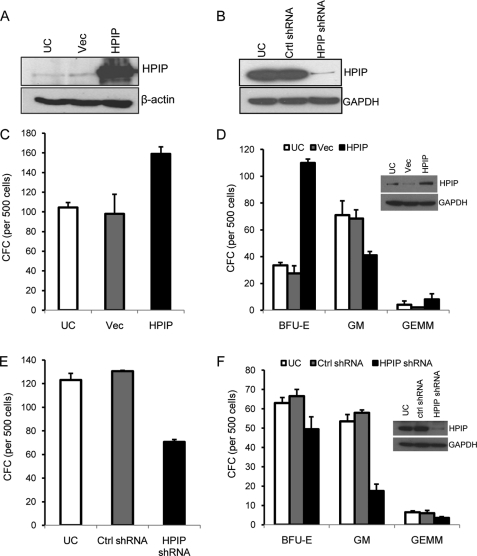
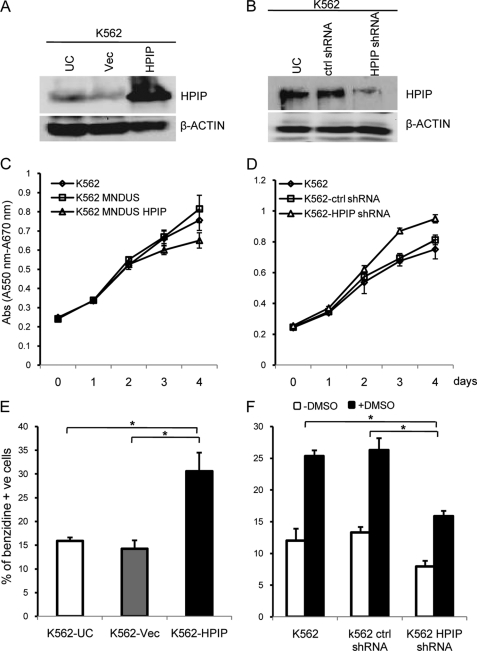
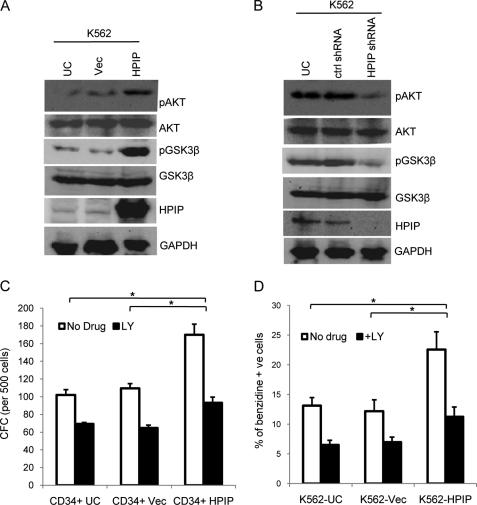
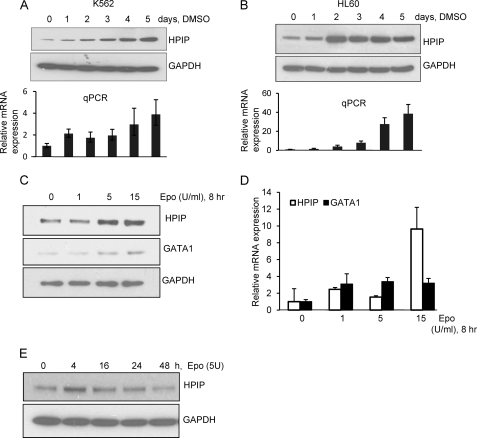
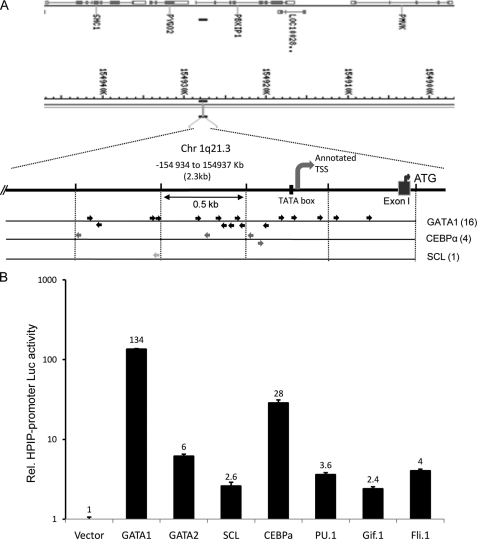
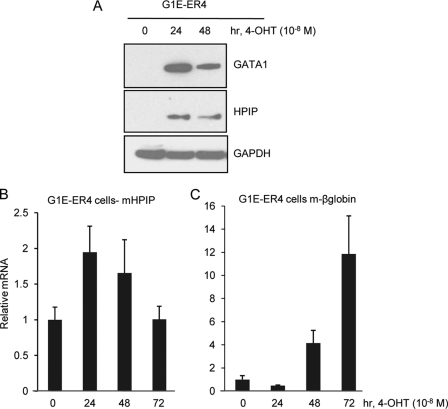
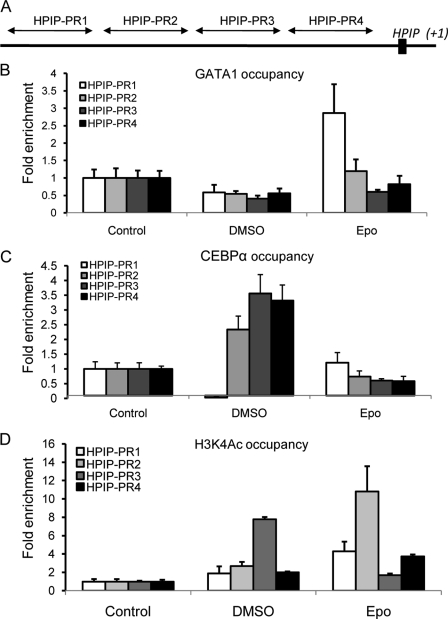
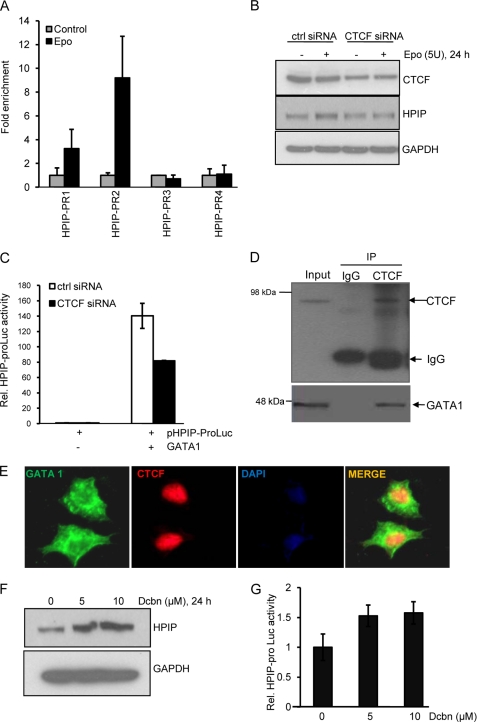
Pre-B-cell leukemia homeobox interacting protein 1 or human PBX1 interacting protein (PBXIP1/HPIP) is a co-repressor of pre-B-cell leukemia homeobox 1 (PBX1) and is also known to regulate estrogen receptor functions by associating with the microtubule network. Despite its initial discovery in the context of hematopoietic cells, little is yet known about the role of HPIP in hematopoiesis. Here, we show that lentivirus-mediated overexpression of HPIP in human CD34(+) cells enhances hematopoietic colony formation in vitro, whereas HPIP knockdown leads to a reduction in the number of such colonies. Interestingly, erythroid colony number was significantly higher in HPIP-overexpressing cells. In addition, forced expression of HPIP in K562 cells, a multipotent erythro-megakaryoblastic leukemia cell line, led to an induction of erythroid differentiation. HPIP overexpression in both CD34(+) and K562 cells was associated with increased activation of the PI3K/AKT pathway, and corresponding treatment with a PI3K-specific inhibitor, LY-294002, caused a reduction in clonogenic progenitor number in HPIP-expressing CD34(+) cells and decreased K562 cell differentiation. Combined, these findings point to an important role of the PI3K/AKT pathway in mediating HPIP-induced effects on the growth and differentiation of hematopoietic cells. Interestingly, HPIP gene expression was found to be induced in K562 cells in response to erythroid differentiation signals such as DMSO and erythropoietin. The erythroid lineage-specific transcription factor GATA1 binds to the HPIP promoter and activates HPIP gene transcription in a CCCTC-binding factor (CTCF)-dependent manner. Co-immunoprecipitation and co-localization experiments revealed the association of CTCF with GATA1 indicating the recruitment of CTCF/GATA1 transcription factor complex onto the HPIP promoter. Together, this study provides evidence that HPIP is a target of GATA1 and CTCF in erythroid cells and plays an important role in erythroid differentiation by modulating the PI3K/AKT pathway.


Figures

FIGURE 1.
FIGURE 1.
Expression of HPIP in hematopoietic tissues and cell lines. A, Western analysis shows the expression of HPIP in various myeloid cell lines. GAPDH was used as loading control. Real time qPCR analysis shows the relative mRNA levels of hpip to gapdh in various hematopoietic tissues (B), and common myeloid progenitors (CMP) and granulocyte-megakaryocytic progenitors (C). The data presented are representative of one of two independent experiments.
FIGURE 2.
FIGURE 2.
HPIP promotes erythroid lineage decisions of human hematopoietic stem cells, CD34+ cells in vitro. Effect of HPIP expression on CFC activity of CD34+ cells. A, following lentivirus transduction, HPIP ectopic expression was verified by Western blotting using anti-HPIP antibody. B, similarly HPIP knockdown was analyzed using anti-HPIP antibody. C, methylcellulose-based CFC assay for HPIP overexpression in CD34+ cells. CFCs colonies were scored after 14 days, and the increase of clonogenic progenitors was determined in cells transduced with HPIP versus the empty control (pMNDUS) or untransduced control CD34+ cells (UC). The number of CFCs plotted is for 500 cells plated initially (C) and various lineages, i.e. burst forming units-erythroid (BFU-E), granulocyte-megakaryocyte (GM) and granulocyte-erythroid-megakaryocyte-monocyte (GEMM) colonies were counted and plotted (D). E, methylcellulose-based CFC assay for HPIP knockdown in CD34+ cells. Similar to HPIP overexpression in CD34+ cells, CFCs colonies were scored after 14 days, and the decrease of clonogenic progenitors was determined in cells transduced with HPIPshRNA versus the control shRNA or untransduced control CD34+ cells (UC). Vec, vector. The number of CFCs plotted is for 500 cells plated initially (E), and various lineages i.e. burst forming units-erythroid (BFU-E), granulocyte-megakaryocyte (GM), and granulocyte-erythroid-megakaryocyte-monocyte (GEMM) colonies were counted and plotted (F). Inset shows the expression of HPIP in CD34+ cells. The data presented are representative of one of two independent experiments.
FIGURE 3.
FIGURE 3.
HPIP expression in K562 alters differentiation. A, Western blot analysis of HPIP overexpression determined using anti-HPIP antibody. B, HPIP knockdown in K562 cells using anti-HPIP antibody. β-Actin was used as loading control. C and D, MTT cell proliferation assay. Differences in proliferation among K562 (untransduced control (UC)), K562 + vector, and K562 + HPIP (C), or K562 (untransduced control-UC) and K562 + control (ctrl) shRNA and K562 + HPIPshRNA (D) after 4 days were detected by measuring the absorbance (Abs) of MTT at 550 nm and subtracting the background absorbance at 690 nm. E and F, erythroid differentiation assay. K562 (UC), K562 + vector and K562 + HPIP (*, p = <0.001) (E) or K562 (UC), K562 + control (ctrl) shRNA, and K562 + HPIPshRNA (F) in the presence and absence of DMSO (1.6%) (*, p = <0.001) were monitored for hemoglobin content after 4 days using benzidine/hydrogen peroxide staining. The histogram shows the percentage of benzidine-positive cells that were scored by light microscopy. The data presented are representative of one of two independent experiments.
FIGURE 4.
FIGURE 4.
Effect of HPIP expression on phosphorylation of AKT and GSK3β in K562 cells. HPIP overexpressing (A) or knockdown (B) K562 cell lysates were subjected to Western blot analysis using indicated phosphorylation-specific and protein-specific antibodies. Untransduced K562 cell lysate was used as untreated control. C, effect of PI3K inhibitor on CFC ability of CD34+-HPIP versus CD34+-vector (Vec) cells or CD34+-untransduced cells. Cells were treated or untreated with LY-294002 (50 μm), and CFC colonies were scored after 14 days, and the number of clonogenic progenitors was determined in cells transduced with HPIP versus the empty control or untransduced control (*, p = 0.003). D, effect of PI3K inhibitor on differentiation ability of K562 + HPIP versus K562 + vector cells or K562-untransduced cells. Cells were treated or untreated with LY-294002 (50 μm) for 24 h, and benzidine-positive cells were determined (*, p = <0.001). The data presented are representative of one of two independent experiments. UC, untransduced control.
FIGURE 5.
FIGURE 5.
Effect of erythroid differentiation inducers, DMSO and Epo, on HPIP expression in leukemic cell lines. Either K562 (A) or HL60 cells (B) were treated with DMSO (1.6%) for the indicated time points, and HPIP expression was analyzed by Western blot (upper panel) or RT-qPCR using gene-specific primers (lower panel). GAPDH serves as internal control. C and D, K562 cells were treated with various doses of Epo for the indicated time points, and then HPIP expression was analyzed by either Western blot (C) or RT-qPCR (D). GAPDH serves as internal loading control and GATA1 as positive control for Epo effect. E, Western analysis shows the effect of Epo at various time points on HPIP expression. The data presented are representative of one of two independent experiments.
FIGURE 6.
FIGURE 6.
E/Meg signature transcription factors activate HPIP promoter. A, schematic representation of human HPIP promoter (2.3 kb) and location of E/MEG transcription factor-binding sites. B, HPIP promoter (2.3 kb) (200 ng) was co-transfected with various transcription factors into K562 cells, and 48 h post-transfection, luciferase activity was determined following the manufacturer's protocol. Renilla firefly luciferase was used as internal control. The relative luciferase activity obtained in triplicates was plotted in a bar graph. The data presented are representative of one of two independent experiments.
FIGURE 7.
FIGURE 7.
Expression analysis of HPIP in G1E-ER4 cells. A, G1E-ER4 cells were treated with 4-OHT (10−8 m) for various time points as mentioned, and cell lysates were subjected to Western analysis using specified antibodies; (B) total RNA were subjected to real time qPCR analysis using gene-specific primers. GAPDH serves as internal control. C, β-globin serves as positive control for GATA1 induction. The data presented are representative of one of two independent experiments.
FIGURE 8.
FIGURE 8.
GATA1 and C/EBPα bind to HPIP promoter. A, schematic representation of HPIP promoter and regions 1–4 (HPIP-PR1–4) selected for ChIP assay. K562 cells were either treated or untreated with DMSO (1.6%) for 24 h or Epo (5 units/ml) for 4 h, and ChIP assay was performed using either anti-GATA1 antibody or anti-C/EBPα antibody. IgG used as control. GATA1 (B), or C/EBPα (C), or acetyl H3K4 (D) occupancies over human HPIP promoter regions (HPIP-PR 1–4) were determined by ChIP assay. The bar values indicate the relative values of qPCR-amplified products using HPIP promoter-specific primers for the specified regions (HPIP-PR 1–4). The data presented are representative of one of two independent experiments.
FIGURE 9.
FIGURE 9.
CTCF regulates HPIP expression in K562 cells. A, K562 cells were either treated or untreated with Epo (5 units/ml) for 4 h, and ChIP assay was performed using anti-CTCF antibody. IgG was used as control. CTCF occupancy over human HPIP promoter regions (HPIP-PR 1–4) was determined by ChIP assay. The bar values indicate the relative values of real time qPCR-amplified products using HPIP promoter-specific primers for the specified regions (HPIP-PR 1–4). B, K562 cells transfected with either control (ctrl) siRNA or CTCF siRNA were lysed, and the cell lysates were subjected to Western analysis using indicated antibodies. C, luciferase assay show the decrease in promoter activity upon CTCF knockdown in GATA1 and hHPIP-promoter luciferase (Luc) co-transfected K562 cells. D, co-immunoprecipitation shows the interaction of CTCF and GATA1 in K562 cells. K562 cell lysates were subjected to immunoprecipitation (IP) with either anti-CTCF antibody or control IgG followed by Western analysis using anti-GATA1 antibody followed by anti-CTCF antibody. E, nuclear co-localization of transiently transfected T7-tagged GATA1 with endogenous CTCF in HeLa cells. F, effect of DNA demethylation agent, decitabine (Dcbn), on HPIP expression. K562 cells were treated with DNA demethylation agent, decitabine, at indicated concentrations, and cell lysates were subjected to Western analysis using specified antibodies. GAPDH serves as internal loading control. G, effect of decitabine at various concentrations on HPIP promoter-Luc activity determined by luciferase assay. The data presented are representative of one of two independent experiments.

Similar articles

Cited by

References

    1. Orkin S. H., Zon L. I. (2008) Hematopoiesis. An evolving paradigm for stem cell biology. Cell 132, 631–644 - PMC - PubMed
    1. Weissman I. L., Anderson D. J., Gage F. (2001) Stem and progenitor cells. Origins, phenotypes, lineage commitments, and transdifferentiations. Annu. Rev. Cell Dev. Biol. 17, 387–403 - PubMed
    1. Sauvageau G., Iscove N. N., Humphries R. K. (2004) In vitro and in vivo expansion of hematopoietic stem cells. Oncogene 23, 7223–7232 - PubMed
    1. Zon L. I. (2008) Intrinsic and extrinsic control of hematopoietic stem-cell self-renewal. Nature 453, 306–313 - PubMed
    1. Hope K. J., Jin L., Dick J. E. (2003) Human acute myeloid leukemia stem cells. Arch. Med. Res. 34, 507–514 - PubMed

Publication types

MeSH terms