. 2012 Feb;262(2):593-604.
doi: 10.1148/radiol.11110896. Epub 2011 Dec 20.

Acute ischemic stroke: infarct core estimation on CT angiography source images depends on CT angiography protocol

Affiliations

Acute ischemic stroke: infarct core estimation on CT angiography source images depends on CT angiography protocol

Benjamin Pulli et al. Radiology. 2012 Feb.

Abstract

Purpose: To test whether the relationship between acute ischemic infarct size on concurrent computed tomographic (CT) angiography source images and diffusion-weighted (DW) magnetic resonance images is dependent on the parameters of CT angiography acquisition protocols.

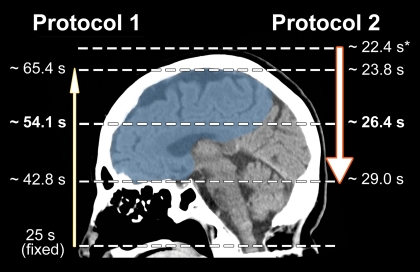
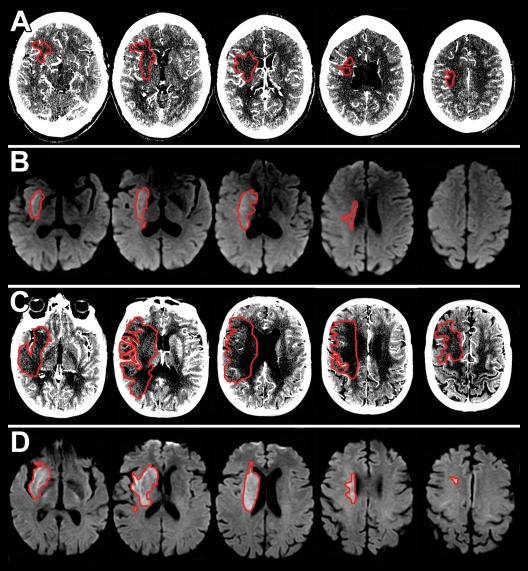
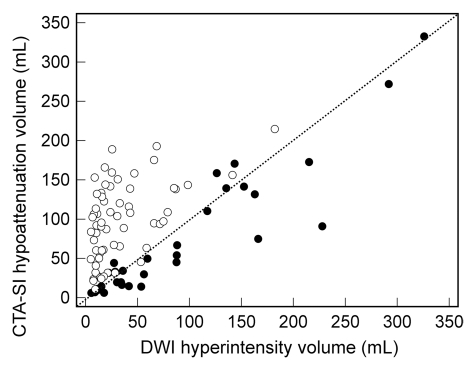
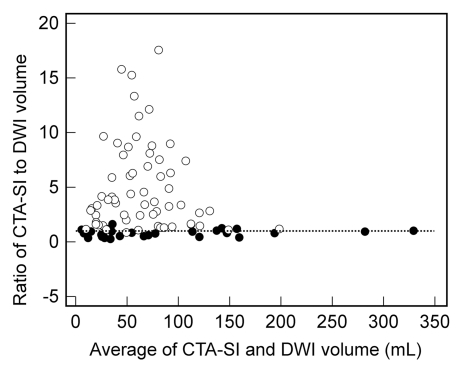
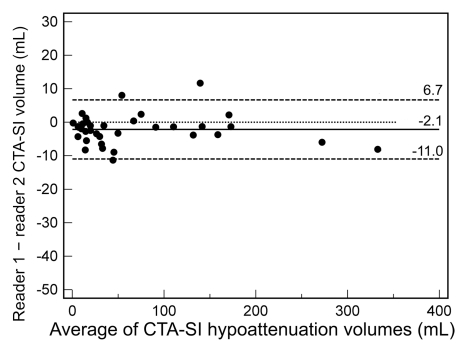
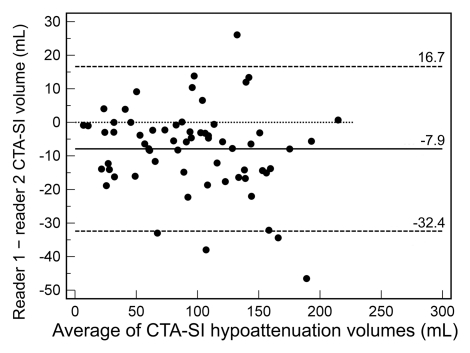
Materials and methods: This retrospective study had institutional review board approval, and all records were HIPAA compliant. Data in 100 patients with anterior-circulation acute ischemic stroke and large vessel occlusion who underwent concurrent CT angiography and DW imaging within 9 hours of symptom onset were analyzed. Measured areas of hyperintensity at acute DW imaging were used as the standard of reference for infarct size. Information regarding lesion volumes and CT angiography protocol parameters was collected for each patient. For analysis, patients were divided into two groups on the basis of CT angiography protocol differences (patients in group 1 were imaged with the older, slower protocol). Intermethod agreement for infarct size was evaluated by using the Wilcoxon signed rank test, as well as by using Spearman correlation and Bland-Altman analysis. Multivariate analysis was performed to identify predictors of marked (≥20%) overestimation of infarct size on CT angiography source images.

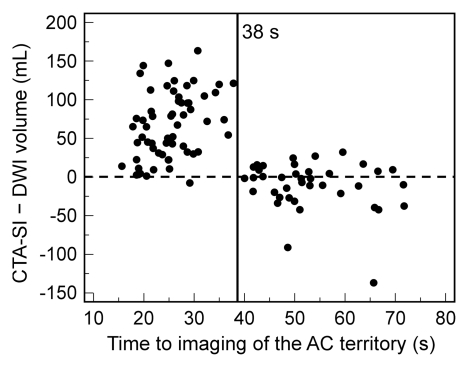
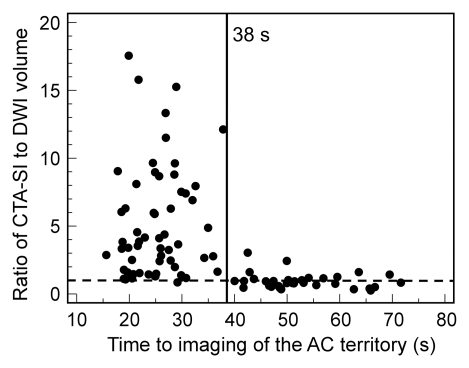
Results: In group 1 (n=35), median hypoattenuation volumes on CT angiography source images were slightly underestimated compared with DW imaging hyperintensity volumes (33.0 vs 41.6 mL, P=.01; ratio=0.83), with high correlation (ρ=0.91). In group 2 (n=65), median volume on CT angiography source images was much larger than that on DW images (94.8 vs 17.8 mL, P<.0001; ratio=3.5), with poor correlation (ρ=0.49). This overestimation on CT angiography source images would have inappropriately excluded from reperfusion therapy 44.4% or 90.3% of patients eligible according to DW imaging criteria on the basis of a 100-mL absolute threshold or a 20% or greater mismatch threshold, respectively. Atrial fibrillation and shorter time from contrast material injection to image acquisition were independent predictors of marked (≥20%) infarct size overestimation on CT angiography source images.

Conclusion: CT angiography protocol changes designed to speed imaging and optimize arterial opacification are associated with significant overestimation of infarct size on CT angiography source images.


Figures

Figure 1:
Figure 1:
Scheme of image acquisition with protocols 1 and 2. Blue = anterior circulation territory. Note the differences in image direction (caudocranial vs craniocaudal), imaging starting point (C1 vertebral body vs vertex), delay time (25-second fixed delay vs SmartPrep), and table speed (3.75–5.63 vs 9.38–39.38 mm/sec), which result in different mean imaging times for the anterior circulation territory. ∗ = Monitoring delay (10 seconds) plus trigger time plus diagnostic delay (3 seconds).
Figure 2:
Figure 2:
Axial, A, C, CT angiography source images and, B, D, DW images. Ischemic lesions are outlined in red. A, B, Images in 65-year-old woman with NIHSSS of 16 and right ICA and MCA M1 occlusion imaged with protocol 1. A, CT angiography source images were acquired 5 hours 20 minutes after symptom onset, and, B, DW images were acquired 20 minutes after the CT examination. The hypoattenuating area in A (13.1 mL) matches the area of decreased diffusion in B (15.2 mL). C, D, Images in 66-year-old woman with NIHSSS of 16 and right MCA M1 occlusion imaged with protocol 2. C, CT angiography source images were acquired 4 hours 30 minutes after symptom onset, and, D, DW images were acquired 23 minutes after the CT examination. The hypoattenuating area in C (159.5 mL) is much larger than the lesion in D (25.3 mL).
Figure 3a:
Figure 3a:
(a) Scatterplot shows correlation between infarct volume on CT angiography source images (CTA-SI) and that on DW images (DWI) for protocol 1 (●) (ρ = 0.912) and protocol 2 (○) (ρ = 0.494). (b) Bland-Altman plot shows agreement between infarct volume on CT angiography source images and that on DW images for protocol 1 (●) (mean, 0.82) and protocol 2 (○) (mean, 5.0). Dotted line = line of equality.
Figure 3b:
Figure 3b:
(a) Scatterplot shows correlation between infarct volume on CT angiography source images (CTA-SI) and that on DW images (DWI) for protocol 1 (●) (ρ = 0.912) and protocol 2 (○) (ρ = 0.494). (b) Bland-Altman plot shows agreement between infarct volume on CT angiography source images and that on DW images for protocol 1 (●) (mean, 0.82) and protocol 2 (○) (mean, 5.0). Dotted line = line of equality.
Figure 4a:
Figure 4a:
Graphs show (a) absolute difference and (b) ratio between infarct volume on CT angiography source images (CTA-SI) and that on DW images (DWI) versus mean time to imaging of the anterior circulation (AC) territory. At imaging times of less than 38 seconds, volume is overestimated at DW imaging in the majority of cases. Dashed line = line of equality.
Figure 4b:
Figure 4b:
Graphs show (a) absolute difference and (b) ratio between infarct volume on CT angiography source images (CTA-SI) and that on DW images (DWI) versus mean time to imaging of the anterior circulation (AC) territory. At imaging times of less than 38 seconds, volume is overestimated at DW imaging in the majority of cases. Dashed line = line of equality.
Figure 5a:
Figure 5a:
Bland-Altman plots of interrater agreement for CT angiography source images (CTA-SI) according to protocol show that (a) protocol 1 resulted in good agreement, with a mean difference of −2.1 mL and narrow limits of agreement (6.7, −11.0 mL), while with (b) protocol 2, the mean difference was −7.9 mL, with limits of agreement of 16.7, −32.4 mL. Dotted line = line of equality.
Figure 5b:
Figure 5b:
Bland-Altman plots of interrater agreement for CT angiography source images (CTA-SI) according to protocol show that (a) protocol 1 resulted in good agreement, with a mean difference of −2.1 mL and narrow limits of agreement (6.7, −11.0 mL), while with (b) protocol 2, the mean difference was −7.9 mL, with limits of agreement of 16.7, −32.4 mL. Dotted line = line of equality.

References

    1. Chalela JA, Kidwell CS, Nentwich LM, et al. Magnetic resonance imaging and computed tomography in emergency assessment of patients with suspected acute stroke: a prospective comparison. Lancet 2007;369(9558):293–298 - PMC - PubMed
    1. Latchaw RE, Alberts MJ, Lev MH, et al. Recommendations for imaging of acute ischemic stroke: a scientific statement from the American Heart Association. Stroke 2009;40(11):3646–3678 - PubMed
    1. Schellinger PD, Bryan RN, Caplan LR, et al. Evidence-based guideline: the role of diffusion and perfusion MRI for the diagnosis of acute ischemic stroke—report of the Therapeutics and Technology Assessment Subcommittee of the American Academy of Neurology. Neurology 2010;75(2):177–185 - PMC - PubMed
    1. Hacke W, Albers G, Al-Rawi Y, et al. The Desmoteplase in Acute Ischemic Stroke Trial (DIAS): a phase II MRI-based 9-hour window acute stroke thrombolysis trial with intravenous desmoteplase. Stroke 2005;36(1):66–73 - PubMed
    1. Furlan AJ, Eyding D, Albers GW, et al. Dose Escalation of Desmoteplase for Acute Ischemic Stroke (DEDAS): evidence of safety and efficacy 3 to 9 hours after stroke onset. Stroke 2006;37(5):1227–1231 - PubMed

Publication types